Answered step by step
Verified Expert Solution
Question
1 Approved Answer
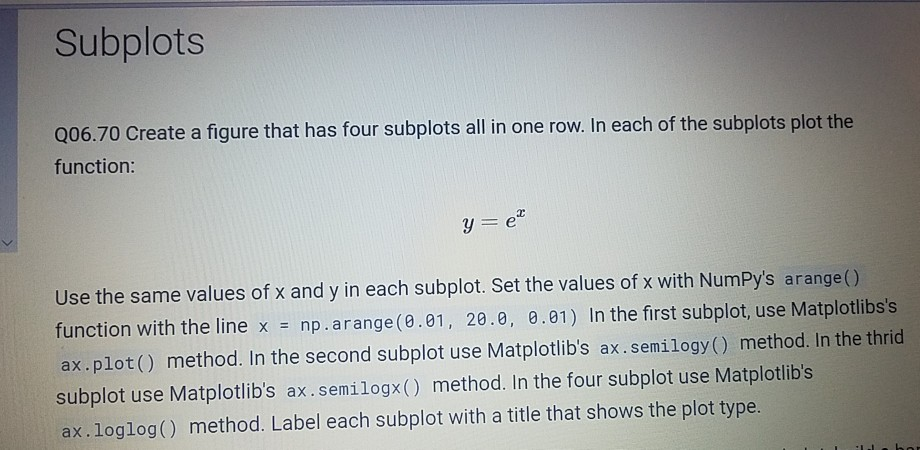
pls use codes that run in Jupyter notebook Subplots Q06.70 Create a figure that has four subplots all in one row. In each of the

pls use codes that run in Jupyter notebook
Subplots Q06.70 Create a figure that has four subplots all in one row. In each of the subplots plot the function: y = e? Use the same values of x and y in each subplot. Set the values of x with NumPy's arange() function with the line x = np.arange(0.01, 20.0, 0.01) In the first subplot, use Matplotlibs's ax.plot() method. In the second subplot use Matplotlib's ax. semilogy () method. In the thrid subplot use Matplotlib's ax.semilogx() method. In the four subplot use Matplotlib's ax.loglog() method. Label each subplot with a title that shows the plot typeStep by Step Solution
There are 3 Steps involved in it
Step: 1

Get Instant Access to Expert-Tailored Solutions
See step-by-step solutions with expert insights and AI powered tools for academic success
Step: 2

Step: 3

Ace Your Homework with AI
Get the answers you need in no time with our AI-driven, step-by-step assistance
Get Started


