plz help me by writing down the excel steps

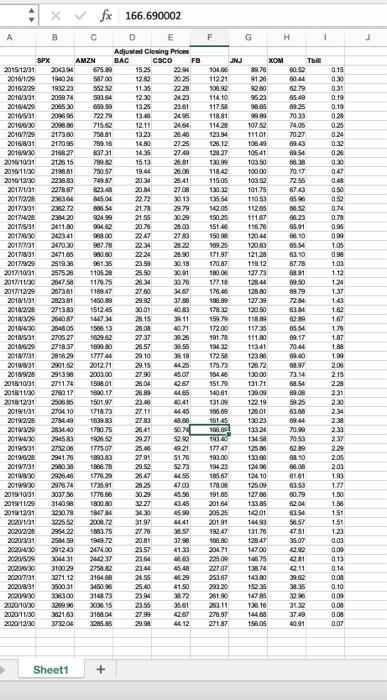
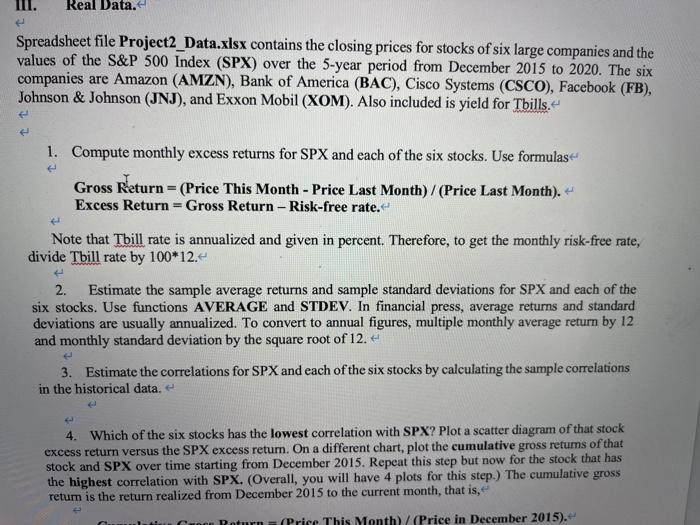
fx 166.690002 H 1 XOM 20.41 B D E F G Adjusted Closing Prices SPX AMZN BAC CSCO FB JNJ 20151231 2043.94 675.89 1525 2291 108.00 80.78 201012 1024 587.00 1282 2025 11221 9128 2016/2/29 193223 22 23 100.92 92.00 2016/3/31 2099 74 583 64 12.30 24.23 114.10 9523 2016/02 2055 30 850 50 1325 23.61 1175 98.65 20165731 209695 722.79 2495 118.81 2016030 2098 715.62 12.11 24.64 11425 10752 2016/7/29 2173.00 75881 13.23 28.43 123 94 111.01 2016/8/31 2170.95 789.16 14.80 2725 128.12 10640 20167930 216 27 83731 14.35 27.40 12827 105.41 2016 10/31 2126.15 15.13 26.81 130.99 10350 2016/11/30 214.81 730 57 19.44 20.05 118.42 100.00 2010 12/30 223883 79.87 20:34 115.05 103.52 2017/1/31 2278 87 80348 20 B4 27.08 13032 101.75 20171228 2963 64 15.04 22.72 2013 18554 15051 20170331 238272 308.54 21.78 29.79 142.05 11205 2017/12/28 2334 20 $24.99 21.55 30.29 150.25 151.07 2017/5/31 2411.30 90462 2078 28. Os 1514 118.70 201710130 202341 98.00 22.47 2783 15008 12044 2017131 2470 30 987.78 2234 28 22 109 25 120.83 20171031 2471.65 980.60 22.24 28.90 171.97 121.28 2017/3/29 2519.38 981.35 23.50 30.18 170.87 119.12 2017/10/31 2575.28 110528 25 50 30.91 180.00 127.73 2017/11/30 266750 117075 2333 3370 177.10 128.40 2017/12/20 2373.61 1109.47 27.80 170.00 128.80 2018/1/31 282381 1430.89 2992 37.88 183.89 127 39 2018/2/20 271383 1512.45 30.01 0.83 1782 120.50 2018/3729 26687 142 2015 18.11 159 1588 2018030 25480S 1500 23.08 10.71 172.00 11735 2018/931 2705.27 1629.62 2737 39.25 191.78 111.80 2014120 275837 1.80 28.57 194.32 113.41 2018/7/31 281829 1777 29.10 18 1725 123.88 2016031 290152 2012.71 29.15 175.73 126.72 20189:28 2913.98 2003.00 2790 4.OT 154.00 130.00 2018 10/31 2711.74 1598.01 28.04 42.67 151.79 13171 205811/30 2780 17 1890.17 28.9 4.65 140.61 130.00 2018 12/31 250585 1501.97 131.00 12219 2019/1/31 2704.10 1718.73 27.11 44.45 100.00 12001 2019 2120 2784.49 1839.83 27.80 48.86 181 45 130.23 2013120 28:40 2841 5074 SBC 13324 20194/30 29450 2927 52. 1345 2019531 275200 1775.07 1921 17141 125.00 2019020 294170 1993.63 27 91 51.78 193.00 133.00 2010/7/31 2990 33 1888.78 2952 52.73 70423 12498 20198/30 2926.40 17.20 2847 456 185 67 124 10 2019/9/30 29/674 1735.91 2325 47.03 17808 125.09 2019 10/31 3037.50 30.29 48.50 191 05 12700 2019/11/20 314098 1800.00 32.27 43.45 20164 133.0 2010 12/31 3030.78 484784 3430 45.00 20525 12201 2020131 3025.52 2008.12 31.97 14.41 201.91 2020/220 295422 1833.75 27.70 38.57 192.47 131.70 2020/331 255459 1940.72 20.81 103.00 128 47 20204/30 291243 2474.00 23.57 41.33 204.71 147.00 20204120 S431 246237 23.66 225.00 10875 202010/30 3100.29 2758.82 234 22707 138.74 2020/7/31 3271.12 3154.68 24.55 16.29 253.67 143.80 2020/8/31 3500 31 3450.56 2540 41.50 203 20 15235 3108.73 2394 2610 1475 2020/10/30 15 23.55 35.61 25.11 136.16 2020 11/30 21.00 3168.04 2799 270.97 144.68 2020/12/30 373204 205.85 29.98 46.12 271.87 158.05 Tbi 80.52 0.15 6044 0:00 02.79 0.31 35.49 0.19 25 0.19 7033 024 24.05 025 70.27 0.24 69.43 0.32 6054 020 00:38 0:30 70.17 0.47 72.55 0.48 87.43 0.50 | 6596 952 66.52 0.74 56.23 0.78 65.91 0.95 10 999 0554 105 63.10 0.98 57.78 103 68.91 112 69.50 124 19.79 137 72.84 6. 182 62.89 167 65.54 1.70 09.17 1.87 70.44 189 8440 199 63.97 203 73.14 2.15 68.54 224 09.08 231 5925 2.30 03.58 234 09.44 238 70.90 233 20:55 237 62.89 229 38.50 205 08.08 203 6161 193 6353 177 50.19 1.50 82.04 1.50 6054 151 56.57 151 123 35.07 0.03 292 0.00 81 0.13 0.14 39.62 0.08 38.35 0.10 3200 009 3132 008 37.49 0.09 40.91 0.07 1780.25 379 3300 Sheet1 + Real Data. Spreadsheet file Project2_Data.xlsx contains the closing prices for stocks of six large companies and the values of the S&P 500 Index (SPX) over the 5-year period from December 2015 to 2020. The six companies are Amazon (AMZN), Bank of America (BAC), Cisco Systems (CSCO), Facebook (FB), Johnson & Johnson (JNJ), and Exxon Mobil (XOM). Also included is yield for Tbills. 1. Compute monthly excess returns for SPX and each of the six stocks. Use formulas Gross Return = (Price This Month - Price Last Month)/(Price Last Month). Excess Return = Gross Return - Risk-free rate. Note that Thill rate is annualized and given in percent. Therefore, to get the monthly risk-free rate, divide Thill rate by 100*12. 2. Estimate the sample average returns and sample standard deviations for SPX and each of the six stocks. Use functions AVERAGE and STDEV. In financial press, average returns and standard deviations are usually annualized. To convert to annual figures, multiple monthly average return by 12 and monthly standard deviation by the square root of 12. 3. Estimate the correlations for SPX and each of the six stocks by calculating the sample correlations in the historical data. 4. Which of the six stocks has the lowest correlation with SPX? Plot a scatter diagram of that stock excess return versus the SPX excess retum. On a different chart, plot the cumulative gross retums of that stock and SPX over time starting from December 2015. Repeat this step but now for the stock that has the highest correlation with SPX. (Overall, you will have 4 plots for this step.) The cumulative gross retum is the return realized from December 2015 to the current month, that is, tin Poturn (Price This Month)/(Price in December 2015). fx 166.690002 H 1 XOM 20.41 B D E F G Adjusted Closing Prices SPX AMZN BAC CSCO FB JNJ 20151231 2043.94 675.89 1525 2291 108.00 80.78 201012 1024 587.00 1282 2025 11221 9128 2016/2/29 193223 22 23 100.92 92.00 2016/3/31 2099 74 583 64 12.30 24.23 114.10 9523 2016/02 2055 30 850 50 1325 23.61 1175 98.65 20165731 209695 722.79 2495 118.81 2016030 2098 715.62 12.11 24.64 11425 10752 2016/7/29 2173.00 75881 13.23 28.43 123 94 111.01 2016/8/31 2170.95 789.16 14.80 2725 128.12 10640 20167930 216 27 83731 14.35 27.40 12827 105.41 2016 10/31 2126.15 15.13 26.81 130.99 10350 2016/11/30 214.81 730 57 19.44 20.05 118.42 100.00 2010 12/30 223883 79.87 20:34 115.05 103.52 2017/1/31 2278 87 80348 20 B4 27.08 13032 101.75 20171228 2963 64 15.04 22.72 2013 18554 15051 20170331 238272 308.54 21.78 29.79 142.05 11205 2017/12/28 2334 20 $24.99 21.55 30.29 150.25 151.07 2017/5/31 2411.30 90462 2078 28. Os 1514 118.70 201710130 202341 98.00 22.47 2783 15008 12044 2017131 2470 30 987.78 2234 28 22 109 25 120.83 20171031 2471.65 980.60 22.24 28.90 171.97 121.28 2017/3/29 2519.38 981.35 23.50 30.18 170.87 119.12 2017/10/31 2575.28 110528 25 50 30.91 180.00 127.73 2017/11/30 266750 117075 2333 3370 177.10 128.40 2017/12/20 2373.61 1109.47 27.80 170.00 128.80 2018/1/31 282381 1430.89 2992 37.88 183.89 127 39 2018/2/20 271383 1512.45 30.01 0.83 1782 120.50 2018/3729 26687 142 2015 18.11 159 1588 2018030 25480S 1500 23.08 10.71 172.00 11735 2018/931 2705.27 1629.62 2737 39.25 191.78 111.80 2014120 275837 1.80 28.57 194.32 113.41 2018/7/31 281829 1777 29.10 18 1725 123.88 2016031 290152 2012.71 29.15 175.73 126.72 20189:28 2913.98 2003.00 2790 4.OT 154.00 130.00 2018 10/31 2711.74 1598.01 28.04 42.67 151.79 13171 205811/30 2780 17 1890.17 28.9 4.65 140.61 130.00 2018 12/31 250585 1501.97 131.00 12219 2019/1/31 2704.10 1718.73 27.11 44.45 100.00 12001 2019 2120 2784.49 1839.83 27.80 48.86 181 45 130.23 2013120 28:40 2841 5074 SBC 13324 20194/30 29450 2927 52. 1345 2019531 275200 1775.07 1921 17141 125.00 2019020 294170 1993.63 27 91 51.78 193.00 133.00 2010/7/31 2990 33 1888.78 2952 52.73 70423 12498 20198/30 2926.40 17.20 2847 456 185 67 124 10 2019/9/30 29/674 1735.91 2325 47.03 17808 125.09 2019 10/31 3037.50 30.29 48.50 191 05 12700 2019/11/20 314098 1800.00 32.27 43.45 20164 133.0 2010 12/31 3030.78 484784 3430 45.00 20525 12201 2020131 3025.52 2008.12 31.97 14.41 201.91 2020/220 295422 1833.75 27.70 38.57 192.47 131.70 2020/331 255459 1940.72 20.81 103.00 128 47 20204/30 291243 2474.00 23.57 41.33 204.71 147.00 20204120 S431 246237 23.66 225.00 10875 202010/30 3100.29 2758.82 234 22707 138.74 2020/7/31 3271.12 3154.68 24.55 16.29 253.67 143.80 2020/8/31 3500 31 3450.56 2540 41.50 203 20 15235 3108.73 2394 2610 1475 2020/10/30 15 23.55 35.61 25.11 136.16 2020 11/30 21.00 3168.04 2799 270.97 144.68 2020/12/30 373204 205.85 29.98 46.12 271.87 158.05 Tbi 80.52 0.15 6044 0:00 02.79 0.31 35.49 0.19 25 0.19 7033 024 24.05 025 70.27 0.24 69.43 0.32 6054 020 00:38 0:30 70.17 0.47 72.55 0.48 87.43 0.50 | 6596 952 66.52 0.74 56.23 0.78 65.91 0.95 10 999 0554 105 63.10 0.98 57.78 103 68.91 112 69.50 124 19.79 137 72.84 6. 182 62.89 167 65.54 1.70 09.17 1.87 70.44 189 8440 199 63.97 203 73.14 2.15 68.54 224 09.08 231 5925 2.30 03.58 234 09.44 238 70.90 233 20:55 237 62.89 229 38.50 205 08.08 203 6161 193 6353 177 50.19 1.50 82.04 1.50 6054 151 56.57 151 123 35.07 0.03 292 0.00 81 0.13 0.14 39.62 0.08 38.35 0.10 3200 009 3132 008 37.49 0.09 40.91 0.07 1780.25 379 3300 Sheet1 + Real Data. Spreadsheet file Project2_Data.xlsx contains the closing prices for stocks of six large companies and the values of the S&P 500 Index (SPX) over the 5-year period from December 2015 to 2020. The six companies are Amazon (AMZN), Bank of America (BAC), Cisco Systems (CSCO), Facebook (FB), Johnson & Johnson (JNJ), and Exxon Mobil (XOM). Also included is yield for Tbills. 1. Compute monthly excess returns for SPX and each of the six stocks. Use formulas Gross Return = (Price This Month - Price Last Month)/(Price Last Month). Excess Return = Gross Return - Risk-free rate. Note that Thill rate is annualized and given in percent. Therefore, to get the monthly risk-free rate, divide Thill rate by 100*12. 2. Estimate the sample average returns and sample standard deviations for SPX and each of the six stocks. Use functions AVERAGE and STDEV. In financial press, average returns and standard deviations are usually annualized. To convert to annual figures, multiple monthly average return by 12 and monthly standard deviation by the square root of 12. 3. Estimate the correlations for SPX and each of the six stocks by calculating the sample correlations in the historical data. 4. Which of the six stocks has the lowest correlation with SPX? Plot a scatter diagram of that stock excess return versus the SPX excess retum. On a different chart, plot the cumulative gross retums of that stock and SPX over time starting from December 2015. Repeat this step but now for the stock that has the highest correlation with SPX. (Overall, you will have 4 plots for this step.) The cumulative gross retum is the return realized from December 2015 to the current month, that is, tin Poturn (Price This Month)/(Price in December 2015)


