Answered step by step
Verified Expert Solution
Link Copied!

Question

1 Approved Answer

plz help me Task 4: L04 In this task your supervisor has asked you to demonstrate and prove your understanding and ability to use the

plz help me
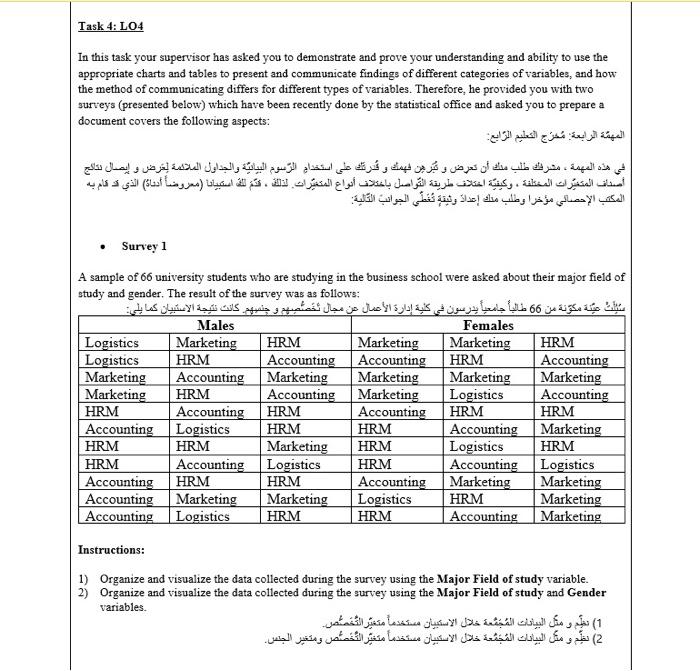
image text in transcribed
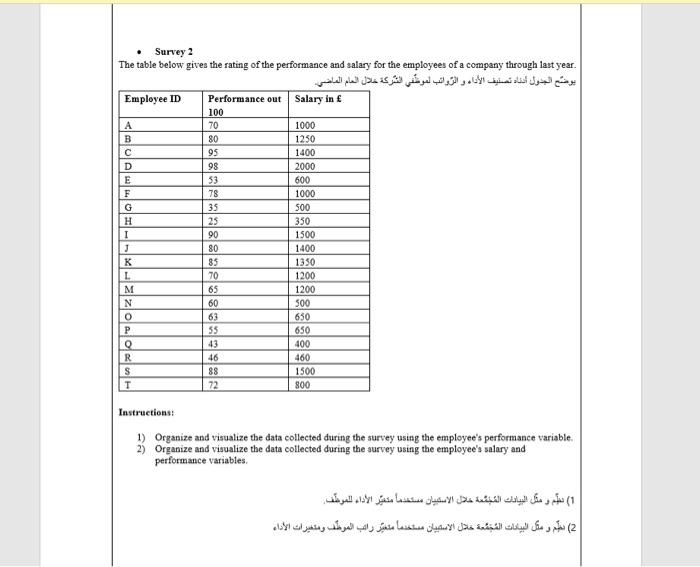
Task 4: L04 In this task your supervisor has asked you to demonstrate and prove your understanding and ability to use the appropriate charts and tables to present and communicate findings of different categories of variables, and how the method of communicating differs for different types of variables. Therefore, he provided you with two surveys (presented below) which have been recently done by the statistical office and asked you to prepare a document covers the following aspects: . ( ) 66 . Survey 1 A sample of 66 university students who are studying in the business school were asked about their major field of study and gender. The result of the survey was as follows: Males Females Logistics Marketing HRM Marketing Marketing HRM Logistics HRM Accounting Accounting HRM Accounting Marketing Accounting Marketing Marketing Marketing Marketing Marketing HRM Accounting Marketing Logistics Accounting HRM Accounting HRM Accounting HRM HRM Accounting Logistics HRM HRM Accounting Marketing HRM HRM Marketing HRM Logistics HRM HRM Accounting Logistics HRM Accounting Logistics Accounting HRM HRM Accounting Marketing Marketing Accounting Marketing Marketing Logistics HRM Marketing Accounting Logistics HRM HRM Accounting Marketing Instructions: 1) Organize and visualize the data collected during the survey using the Major Field of study variable. 2) Organize and visualize the data collected during the survey using the Major Field of study and Gender variables. 1) 2) . Survey 2 The table below gives the rating of the performance and salary for the employees of a company through last year. Employee ID A B c D E F G H 1 Performance out Salary in 100 70 1000 80 1250 95 1400 98 2000 53 600 78 1000 35 500 25 350 90 1500 80 1400 85 1350 70 1200 65 1200 60 500 63 650 55 650 43 400 46 460 88 1500 72 800 K L NI N 0 P . Instructions: 1) Organize and visuali collected during the survey using the employee's performance variable, 2) Organize and visualize the data collected during the survey using the employee's salary and performance variables 1) 2)

Step by Step Solution

There are 3 Steps involved in it

Step: 1

blur-text-image

Get Instant Access to Expert-Tailored Solutions

See step-by-step solutions with expert insights and AI powered tools for academic success

Step: 2

blur-text-image

Step: 3

blur-text-image

Ace Your Homework with AI

Get the answers you need in no time with our AI-driven, step-by-step assistance

Get Started

Students also viewed these Accounting questions

Question

1. What are the peculiarities of viruses ?

Answered: 1 week ago

Question

Describe the menstrual cycle in a woman.

Answered: 1 week ago

Question

=+1. What does healing mean to you now?

Answered: 1 week ago