Answered step by step
Verified Expert Solution
Link Copied!

Question

1 Approved Answer

PLZ HELP The financial statements of X Ltd and Y Ltd, two companies in the same industry, for the years ended 31 December 2020 and

PLZ HELP

The financial statements of X Ltd and Y Ltd, two companies in the same industry, for the years ended 31 December 2020 and 2021 are presented below.
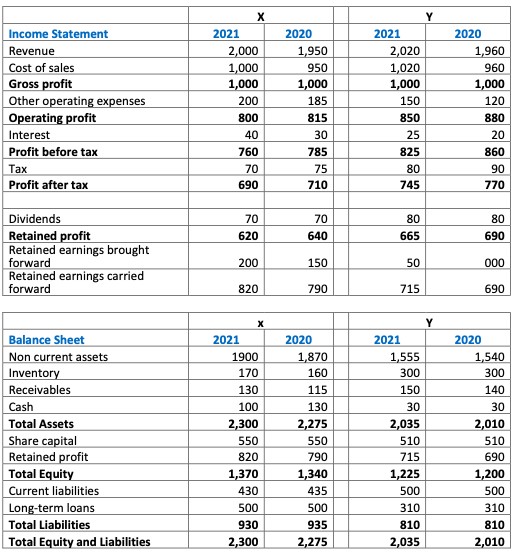
image text in transcribed

  1. Calculate the relevant financial ratios to assess the profitability and liquidity of the two companies in 2020 and 2021. [15 marks]

  2. b) Prepare a report based on the financial information provided and the relevant financial ratios to assess the relative profitability and liquidity of X and Y in 2020 and 2021.

  3. c) Prepare a report based on the DuPont analysis for each company to discuss the change in Return on Equity (ROE) between 2020 and 2021.

Income Statement Revenue Cost of sales Gross profit Other operating expenses Operating profit Interest Profit before tax Tax Profit after tax 2021 2,000 1,000 1,000 200 800 40 760 70 690 2020 1,950 950 1,000 185 815 30 785 75 Y 2021 2,020 1,020 1,000 150 850 25 825 80 745 2020 1,960 960 1,000 120 880 20 860 90 770 710 70 620 70 640 80 665 80 690 Dividends Retained profit Retained earnings brought forward Retained earnings carried forward 200 150 50 000 820 790 715 690 Balance Sheet Non current assets Inventory Receivables Cash Total Assets Share capital Retained profit Total Equity Current liabilities Long-term loans Total Liabilities Total Equity and Liabilities 2021 1900 170 130 100 2,300 550 820 1,370 430 500 930 2,300 2020 1,870 160 115 130 2,275 550 790 1,340 435 500 Y 2021 1,555 300 150 30 2,035 510 715 1,225 500 2020 1,540 300 140 30 2,010 510 690 1,200 500 310 810 2,010 310 935 810 2,035 2,275 Income Statement Revenue Cost of sales Gross profit Other operating expenses Operating profit Interest Profit before tax Tax Profit after tax 2021 2,000 1,000 1,000 200 800 40 760 70 690 2020 1,950 950 1,000 185 815 30 785 75 Y 2021 2,020 1,020 1,000 150 850 25 825 80 745 2020 1,960 960 1,000 120 880 20 860 90 770 710 70 620 70 640 80 665 80 690 Dividends Retained profit Retained earnings brought forward Retained earnings carried forward 200 150 50 000 820 790 715 690 Balance Sheet Non current assets Inventory Receivables Cash Total Assets Share capital Retained profit Total Equity Current liabilities Long-term loans Total Liabilities Total Equity and Liabilities 2021 1900 170 130 100 2,300 550 820 1,370 430 500 930 2,300 2020 1,870 160 115 130 2,275 550 790 1,340 435 500 Y 2021 1,555 300 150 30 2,035 510 715 1,225 500 2020 1,540 300 140 30 2,010 510 690 1,200 500 310 810 2,010 310 935 810 2,035 2,275

Step by Step Solution

There are 3 Steps involved in it

Step: 1

blur-text-image

Get Instant Access to Expert-Tailored Solutions

See step-by-step solutions with expert insights and AI powered tools for academic success

Step: 2

blur-text-image_2

Step: 3

blur-text-image_3

Ace Your Homework with AI

Get the answers you need in no time with our AI-driven, step-by-step assistance

Get Started

Recommended Textbook for

International Corporate Reporting Global And Diverse

Authors: Pauline Weetman, Ioannis Tsalavoutas, Paul Gordon

5th Edition

1138364991, 9781138364998

More Books

Students also viewed these Accounting questions

Question

How can implements management decisions using the POLC functions.

Answered: 1 week ago