plz solve this
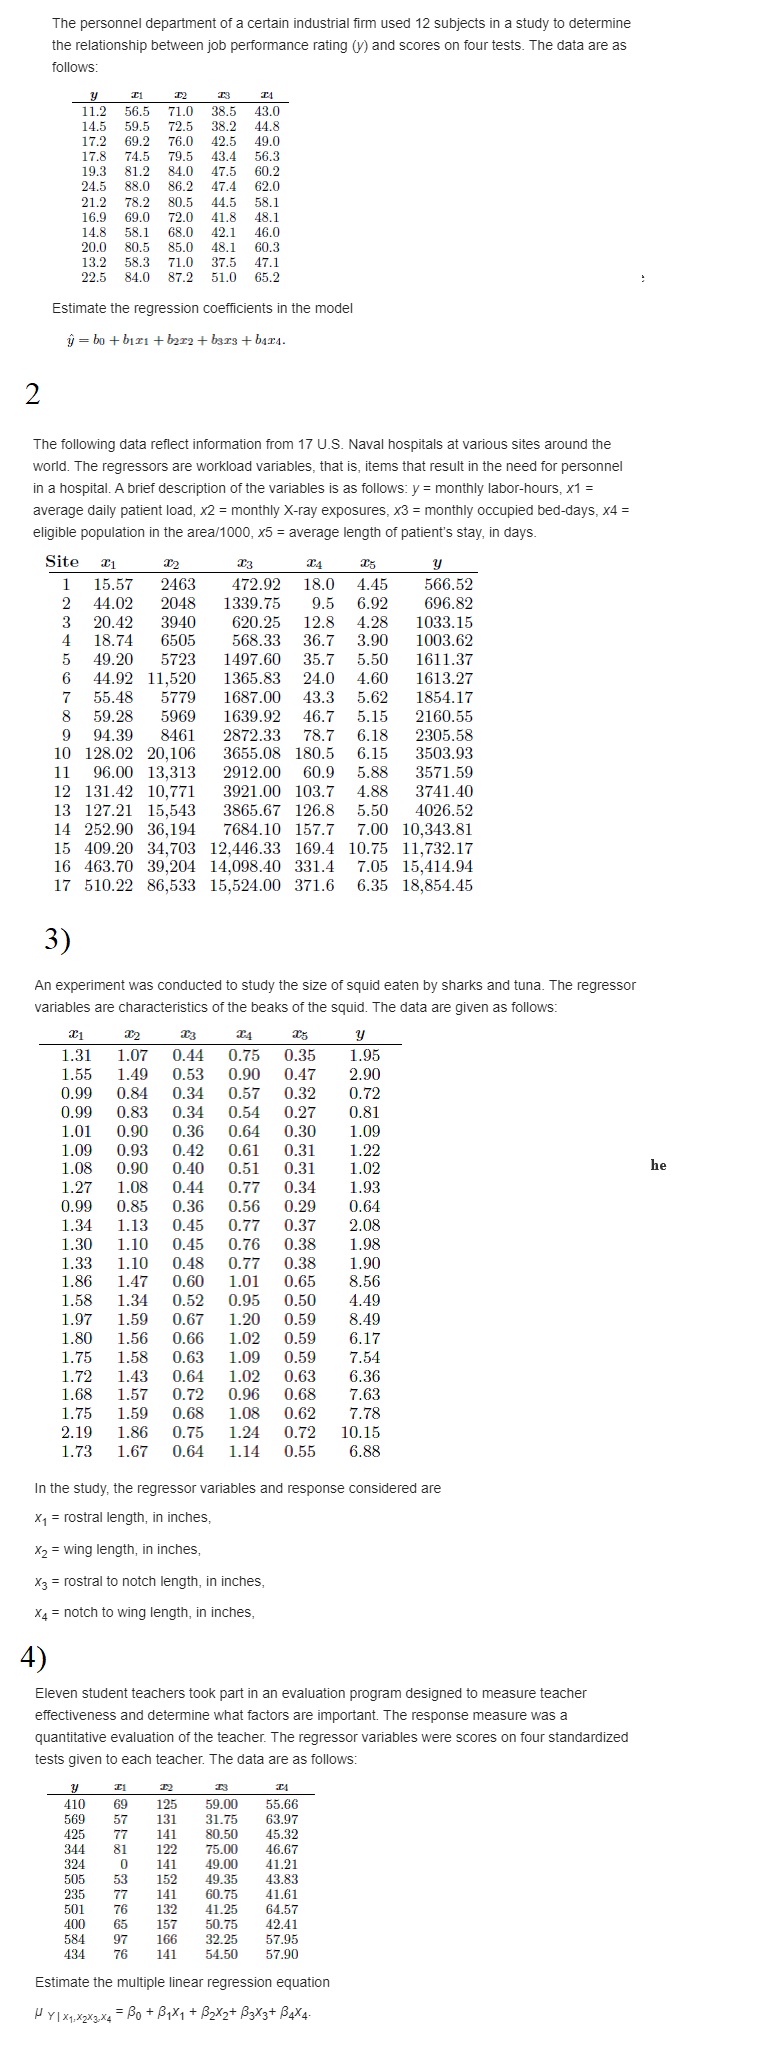
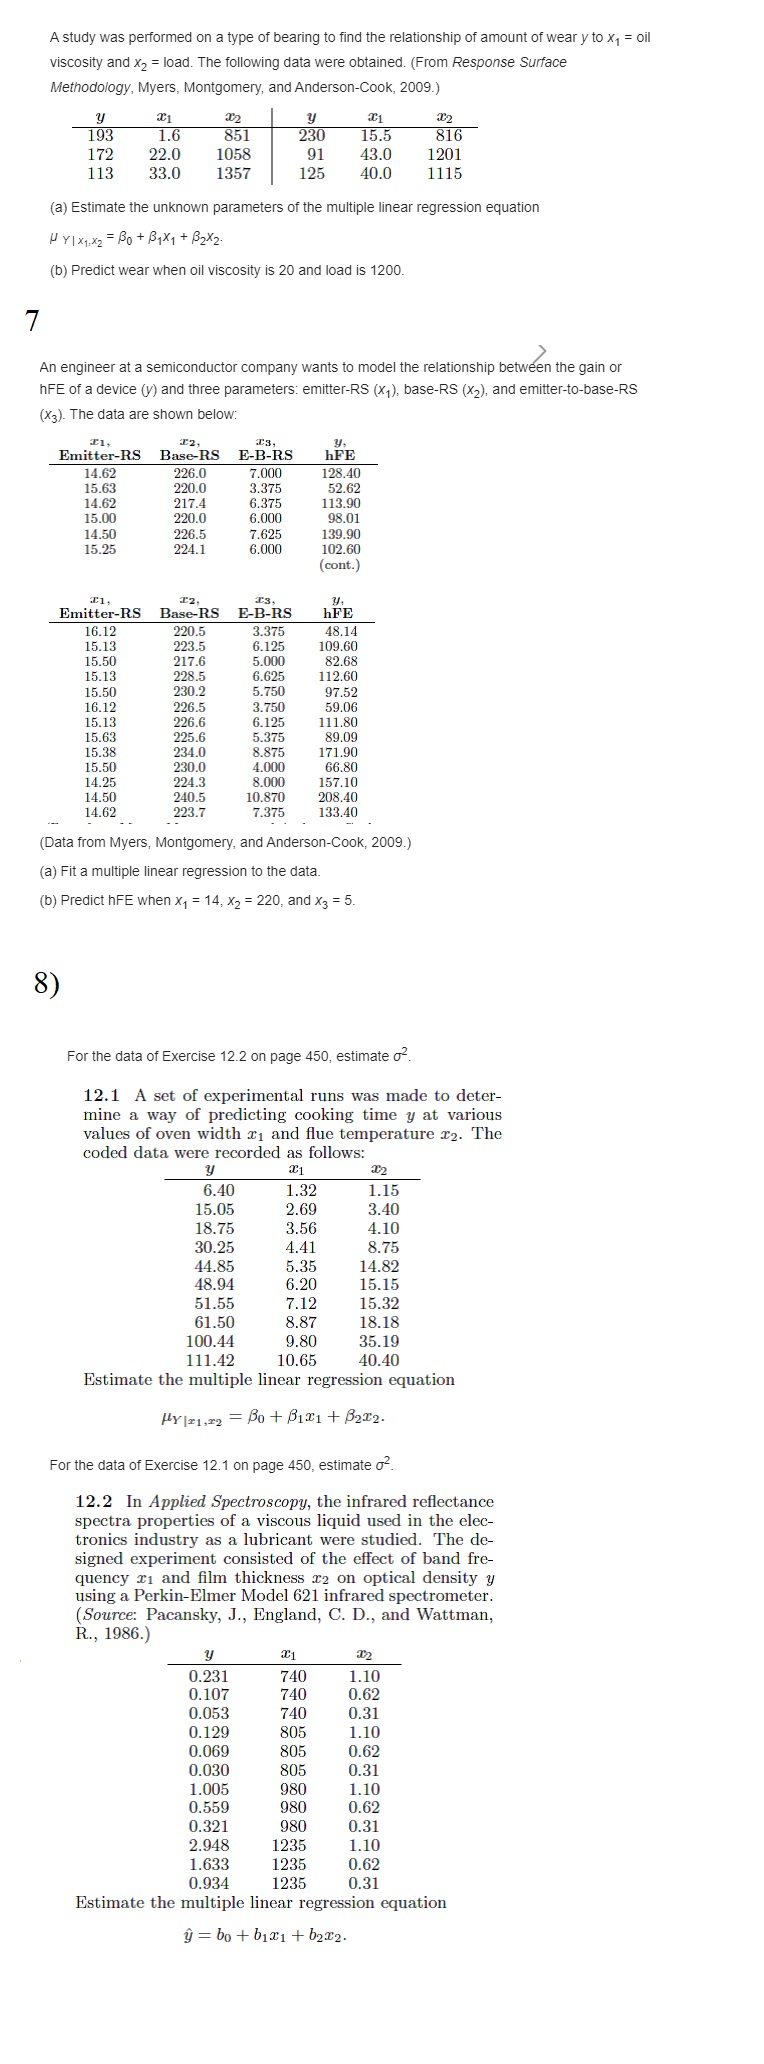
The personnel department of a certain industrial firm used 12 subjects in a study to determine the relationship between job performance rating (y) and scores on four tests. The data are as follows: I1 TA 11.2 56.5 71.0 38.5 43.0 14.5 59.5 72.5 38.2 44.8 17.2 69.2 76.0 42.5 49.0 17.8 74.5 79.5 43.4 56.3 19.3 81.2 84.0 47.5 60.2 24.5 88.0 86.2 47.4 62.0 21.2 78.2 80.5 44.5 58.1 16.9 69.0 7 41.8 48.1 14.8 58.1 68.0 42.1 46.0 20.0 80.5 85.0 48.1 60.3 13.2 58.3 71.0 37.5 47.1 22.5 84.0 51.0 65.2 Estimate the regression coefficients in the model y = bo + bix1 + 62x2 + bars + bar4. 2 The following data reflect information from 17 U.S. Naval hospitals at various sites around the world. The regressors are workload variables, that is, items that result in the need for personnel in a hospital. A brief description of the variables is as follows: y = monthly labor-hours, x1 = average daily patient load, x2 = monthly X-ray exposures, x3 = monthly occupied bed-days, x4 = eligible population in the area/1000, x5 = average length of patient's stay, in days. Site X1 y 15.57 2463 172.92 18.0 4.45 566.52 44.02 2048 1339.75 9.5 6.92 696.82 20.42 620.25 12.8 4.28 1033.15 18.74 6505 568.33 36.7 3.90 1003.62 49.20 5723 1497.60 35.7 5.50 1611.37 6 44.92 11,520 1365.83 24.0 4.60 1613.27 55.48 5779 1687.00 43.3 5.62 1854.17 59.28 5969 1639.92 46.7 5.15 2160.55 9 94.39 8461 2872.33 78.7 6.18 2305.58 10 128.02 20,106 3655.08 180.5 6.15 3503.93 11 96.00 13,313 2912.00 60.9 5.88 3571.59 12 131.42 10,771 3921.00 103.7 4.88 3741.40 13 127.21 15,543 3865.67 126.8 5.50 4026.52 14 252.90 36,194 7684.10 157.7 7.00 10,343.81 15 409.20 34,703 12,446.33 169.4 10.75 11,732.17 16 463.70 39,204 14,098.40 331.4 7.05 15,414.94 17 510.22 86,533 15,524.00 371.6 6.35 18,854.45 3) An experiment was conducted to study the size of squid eaten by sharks and tuna. The regressor variables are characteristics of the beaks of the squid. The data are given as follows: y 1.31 1.07 0.44 0.75 0.35 1.95 1.55 1.49 0.53 0.90 0.47 2.90 0.99 0.84 0.34 0.57 0.32 0.72 0.99 0.83 0.34 0.54 0.27 0.81 1.01 0.90 0.36 0.64 0.30 1.09 1.09 0.93 0.42 0.61 0.31 1.22 he 1.08 0.90 0.40 0.51 0.31 1.02 1.27 1.08 0.44 0.77 0.34 1.93 0.99 0.85 0.36 0.56 0.29 0.64 1.34 1.13 0.45 0.77 0.37 2.08 1.30 1.10 0.45 0.76 0.38 1.98 1.33 1.10 0.48 0.77 0.38 1.90 1.86 1.47 0.60 1.01 0.65 8.56 1.58 1.34 0.52 0.95 0.50 4.49 1.97 1.59 0.67 1.20 0.59 8.49 1.80 1.56 0.66 1.02 0.59 6.17 1.75 1.58 0.63 1.09 0.59 7.54 1.72 1.43 0.64 1.02 0.63 6.36 1.68 1.57 0.72 0.96 0.68 7.63 1.75 1.59 0.68 1.08 0.62 7.78 2.19 1.86 0.75 1.24 0.72 10.15 1.73 1.67 0.64 1.14 0.55 6.88 In the study, the regressor variables and response considered are *1 = rostral length, in inches, X2 = wing length, in inches, X3 = rostral to notch length, in inches, x4 = notch to wing length, in inches, 4) Eleven student teachers took part in an evaluation program designed to measure teacher effectiveness and determine what factors are important. The response measure was a quantitative evaluation of the teacher. The regressor variables were scores on four standardized tests given to each teacher. The data are as follows: y 410 69 125 59.00 55.66 569 57 131 31.75 63.97 425 77 141 80.50 45.32 344 81 122 75.00 46.67 324 141 49.00 41.21 505 53 152 49.35 43.83 235 77 141 60.75 41.61 501 76 132 41.25 64.57 400 65 157 50.75 42.41 584 97 166 32.25 57.95 434 76 141 54.50 57.90 Estimate the multiple linear regression equation U Y 1 X1, *2X3x4 = Bo + B1X1 + B2X2+ B3X3+ B4X4.A study was performed on a type of bearing to find the relationship of amount of wear y to x, = oil viscosity and X2 = load. The following data were obtained. (From Response Surface Methodology, Myers, Montgomery, and Anderson-Cook, 2009.) y C1 y C1 193 1.6 851 230 15.5 816 172 22.0 1058 91 43.0 1201 113 33.0 1357 125 40.0 1115 (a) Estimate the unknown parameters of the multiple linear regression equation MY 1 x1,*2 = Bo + B1X1 + 32X2 (b) Predict wear when oil viscosity is 20 and load is 1200. 7 An engineer at a semiconductor company wants to model the relationship between the gain or hFE of a device (y) and three parameters: emitter-RS (x,), base-RS (X2), and emitter-to-base-RS (X3). The data are shown below: T1, 12, Emitter-RS Base-RS E-B-RS hFE 14.62 226.0 7.000 128.40 15.63 220.0 3.375 52.62 14.62 217.4 6.375 113.90 15.00 220.0 6.000 98.01 14.50 226.5 7.625 139.90 15.25 224.1 6.000 102.60 (cont. Emitter-RS Base-RS E-B-RS hFE 16.12 220.5 3.375 48.14 15.13 223.5 6.125 109.60 15.50 217.6 5.000 82.68 15.13 228.5 6.625 112.60 15.50 230.2 5.750 97.52 16.12 226.5 3.750 59.06 15.13 226.6 6.125 111.80 15.63 225.6 5.375 89.09 15.38 234.0 8.875 171.90 15.50 230.0 4.000 66.80 14.25 224.3 8.000 157.10 14.50 240.5 10.870 208.40 14.62 223.7 7.375 133.40 (Data from Myers, Montgomery, and Anderson-Cook, 2009.) (a) Fit a multiple linear regression to the data. (b) Predict hFE when x1 = 14, X2 = 220, and X3 = 5. 8) For the data of Exercise 12.2 on page 450, estimate of. 12.1 A set of experimental runs was made to deter- mine a way of predicting cooking time y at various values of oven width x1 and flue temperature r2. The coded data were recorded as follows: y 6.40 1.32 1.15 15.05 2.69 3.40 18.75 3.56 4.10 30.25 4.41 8.75 44.85 5.35 14.82 48.94 6.20 15.15 51.55 7.12 15.32 61.50 8.87 18.18 100.44 9.80 35.19 111.42 10.65 40.40 Estimate the multiple linear regression equation HY |21,22 = Bo + BIT1 + B212. For the data of Exercise 12.1 on page 450, estimate of. 12.2 In Applied Spectroscopy, the infrared reflectance spectra properties of a viscous liquid used in the elec- tronics industry as a lubricant were studied. The de- signed experiment consisted of the effect of band fre- quency x1 and film thickness x2 on optical density y using a Perkin-Elmer Model 621 infrared spectrometer. (Source: Pacansky, J., England, C. D., and Wattman, R., 1986.) X1 0.231 740 1.10 0.107 740 0.62 0.053 740 0.31 0.129 805 1.10 0.069 805 0.62 0.030 805 0.31 1.005 980 1.10 0.559 980 0.62 0.321 980 0.31 2.948 1235 1.10 1.633 1235 0.62 0.934 235 0.31 Estimate the multiple linear regression equation y = bo + b121 + b212


