Points: 0.6 of 3 Listed below are the overhead widths (in cm) of seals measured from photographs and the weights (in kg) of the seals.
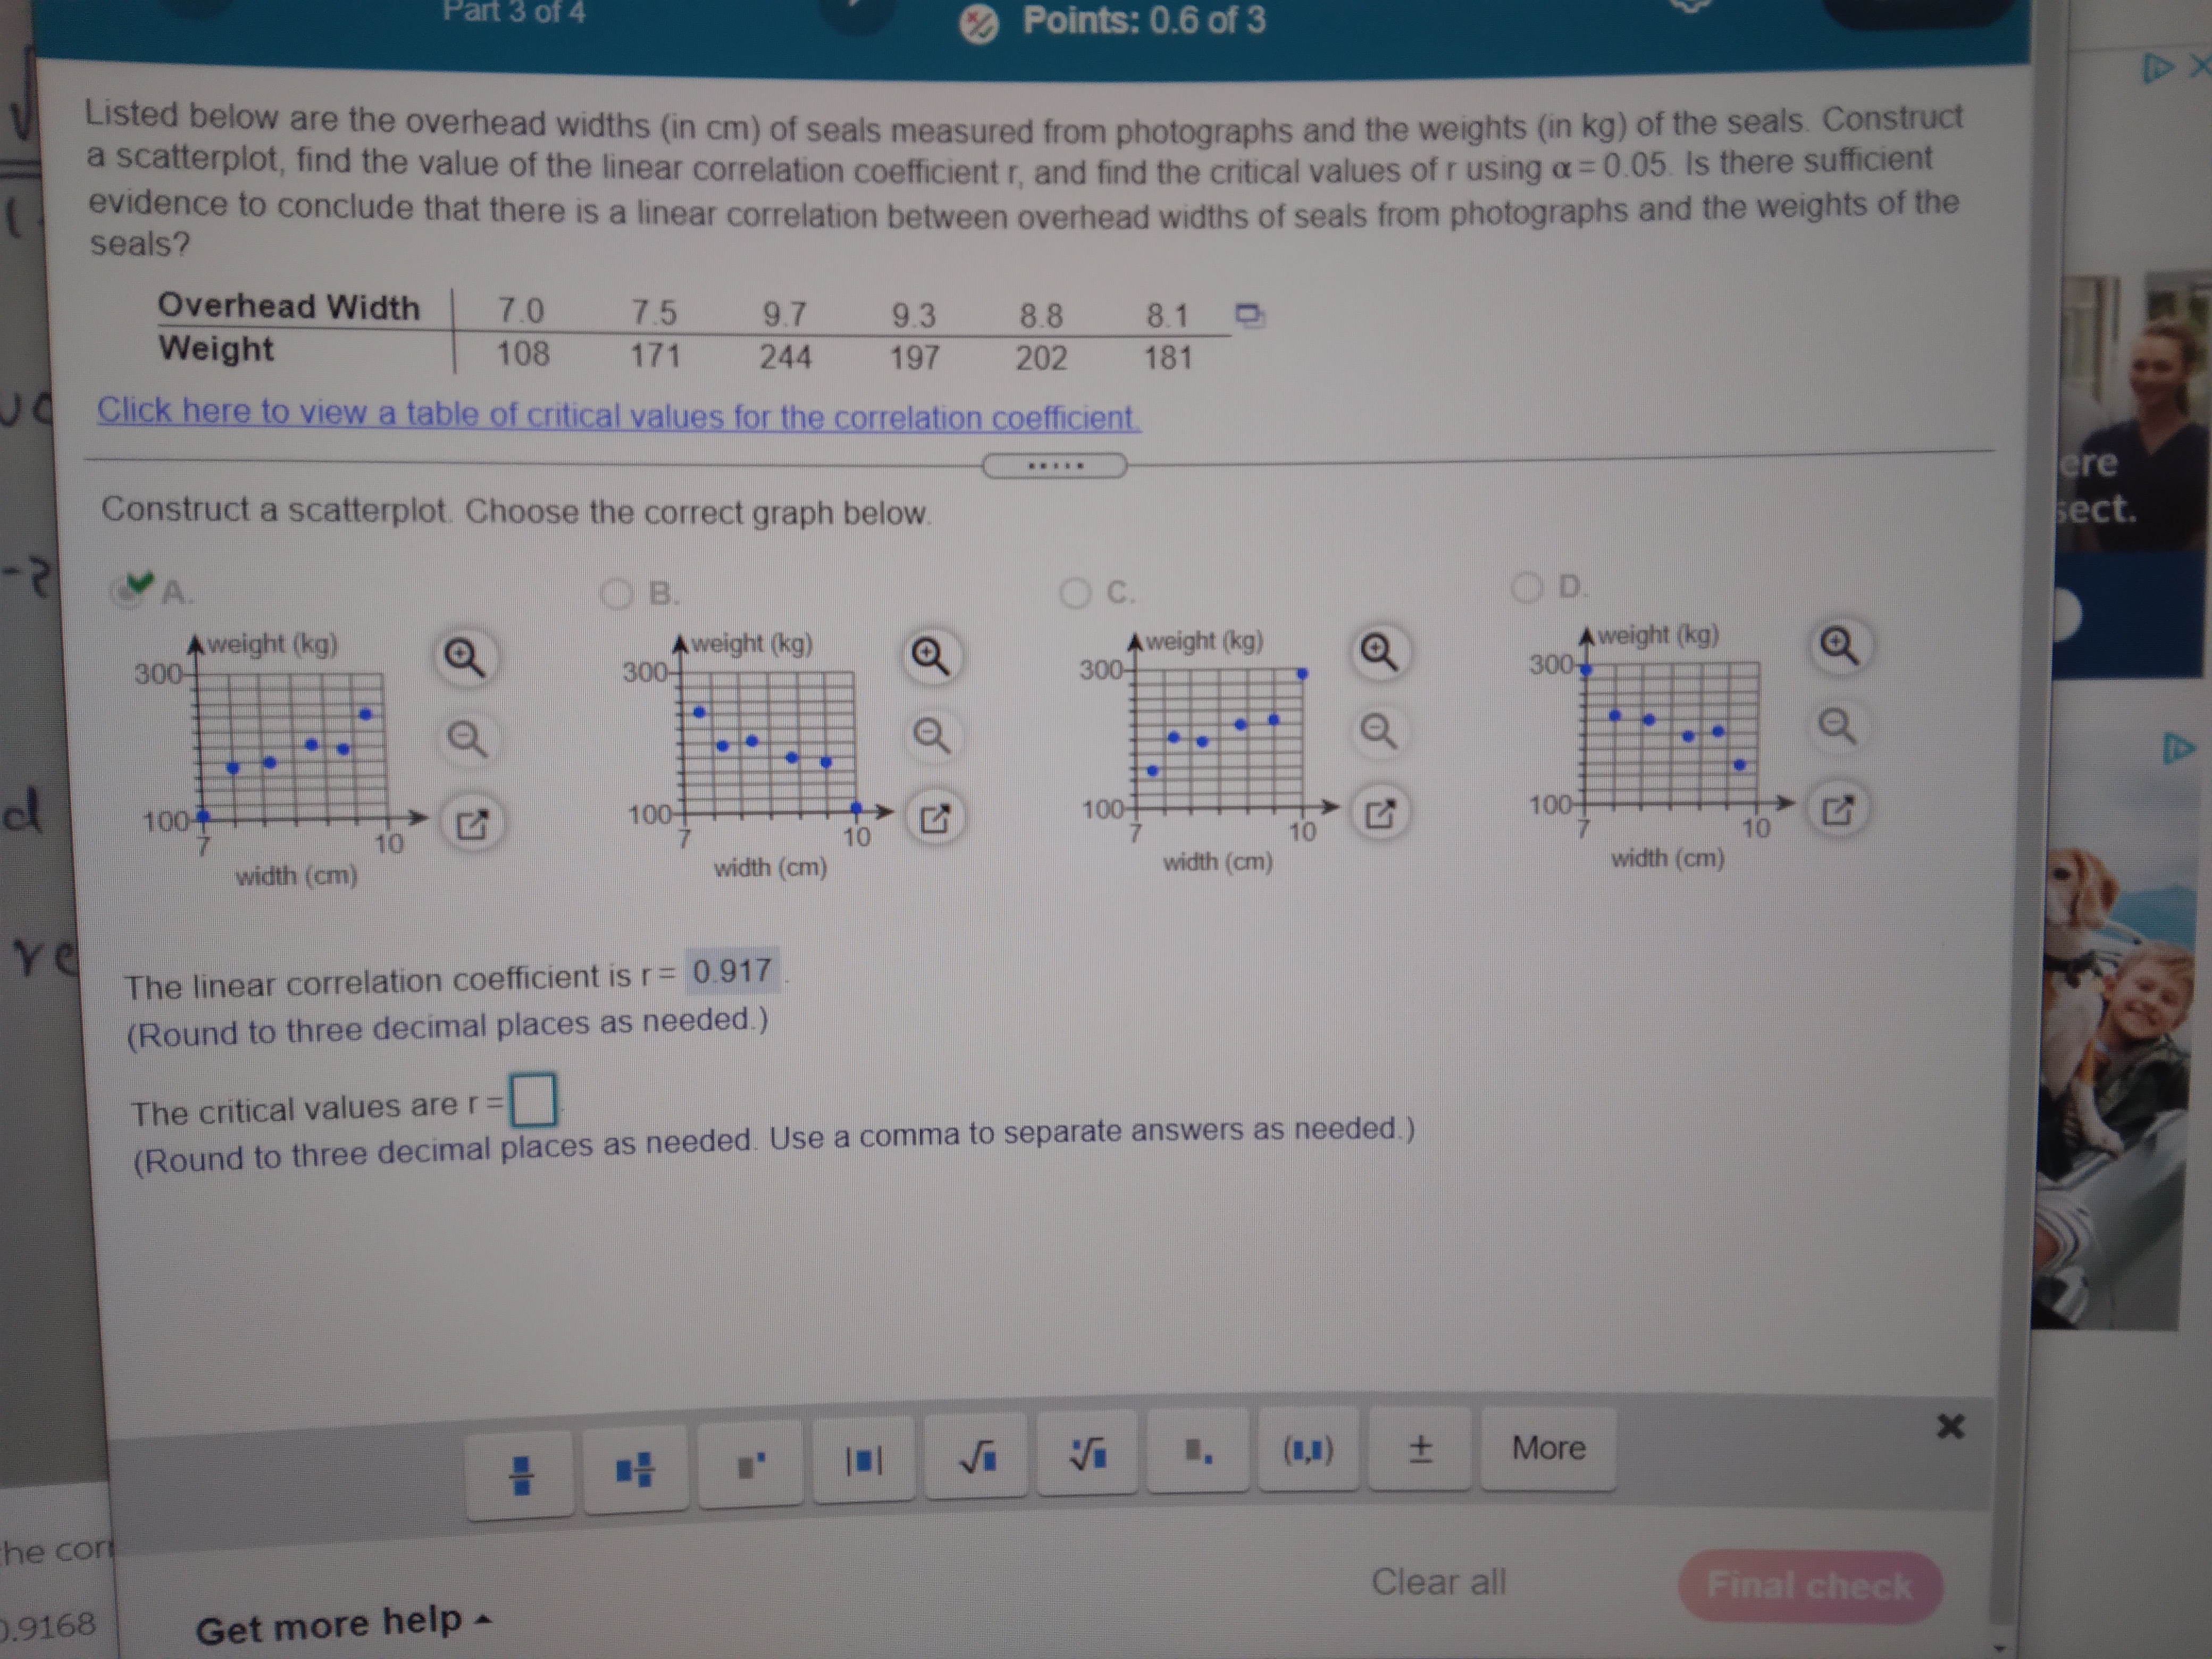
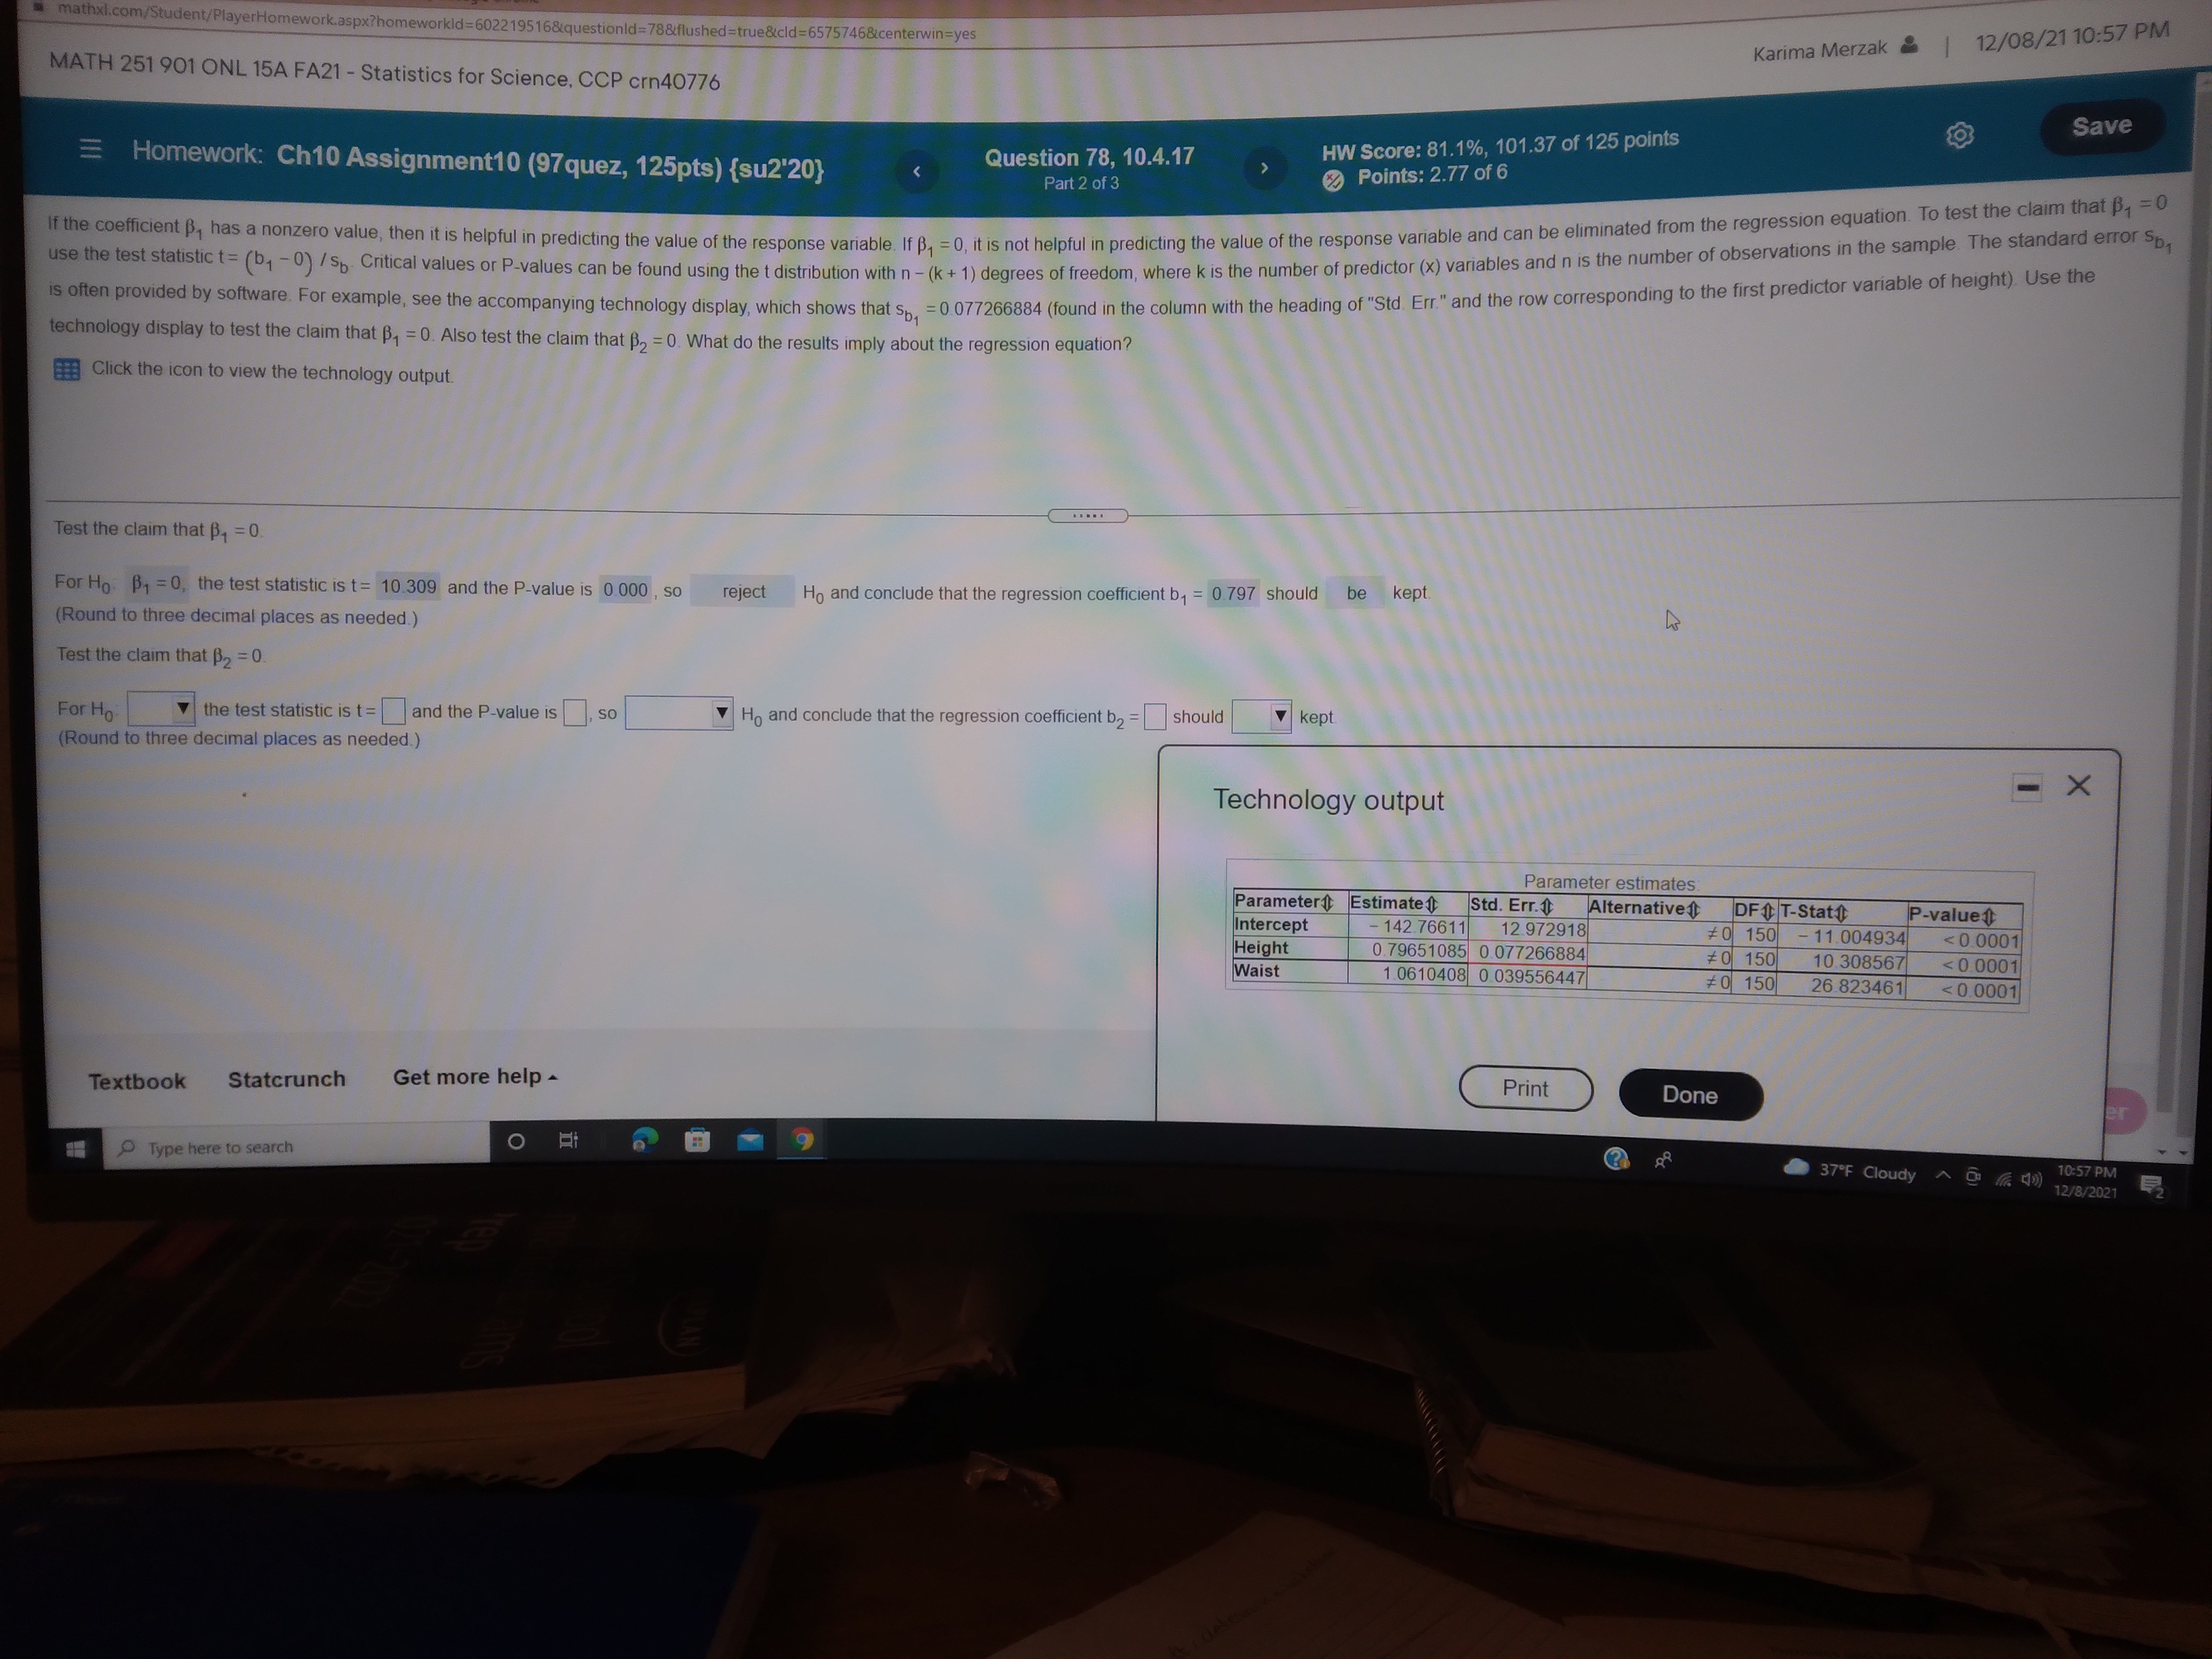
Points: 0.6 of 3 Listed below are the overhead widths (in cm) of seals measured from photographs and the weights (in kg) of the seals. Construct a scatterplot, find the value of the linear correlation coefficient r, and find the critical values of r using a = 0.05. Is there sufficient seals? evidence to conclude that there is a linear correlation between overhead widths of seals from photographs and the weights of the Overhead Width 7.0 7.5 9.7 Weight 9.3 8.8 8.1 0 108 171 244 197 202 181 Click here to view a table of critical values for the correlation coefficient . . . . . Construct a scatterplot. Choose the correct graph below. ere sect. OB O C. OD A weight (kg) 300- A weight (kg) A weight (kg) 300- A weight (kg) 300- 300- Q 100- 100-+ 100- 100- 10 10 10 width (cm) width (cm) width (cm) width (cm) Ye The linear correlation coefficient is r = 0.917 (Round to three decimal places as needed.) The critical values are r =] (Round to three decimal places as needed. Use a comma to separate answers as needed.) VI More X he cort ).9168 Get more help - Clear all Final checkd=6022195168questionld=78&flushed=true&cld=6575746¢erwin=yes Karima Merzak | 12/08/21 10:57 PM MATH 251 901 ONL 15A FA21 - Statistics for Science, CCP crn40776 Save = Homework: Ch10 Assignment10 (97quez, 125pts) {su2'20} Question 78, 10.4.17 HW Score: 81.1%, 101.37 of 125 points Part 2 of 3 Points: 2.77 of 6 If the coefficient B, has a nonzero value, then it is helpful in predicting the value of the response variable. If B, = 0, it is not helpful in predicting the value of the response variable and can be eliminated from the regression equation. To test the claim that By = 0 use the test statistic t= (b, -0) / Sp Critical values or P-values can be found using the t distribution with n - (k + 1) degrees of freedom, where k is the number of predictor (x) variables and n is the number of observations in the sample. The standard error sp. is often provided by software. For example, see the accompanying technology display, which shows that Spy =0 077266884 (found in the column with the heading of "Std. Err." and the row corresponding to the first predictor variable of height) Use the technology display to test the claim that B, = 0. Also test the claim that B2 = 0. What do the results imply about the regression equation? Click the icon to view the technology output. Test the claim that By = 0. For Ho By = 0, the test statistic is t= 10.309 and the P-value is 0.000 , so reject Ho and conclude that the regression coefficient by = 0.797 should be kept. (Round to three decimal places as needed.) Test the claim that By = 0. For Ho the test statistic is t= ]and the P-value is ], so Ho and conclude that the regression coefficient b2 = should kept (Round to three decimal places as needed. ) - X Technology output Parameter estimates Parameter Estimate Std. Err. & Alternative DF1 T-State P-value f Intercept - 142.76611 12.972918 #0 150 - 11 004934
Step by Step Solution
There are 3 Steps involved in it
Step: 1
Get Instant Access to Expert-Tailored Solutions
See step-by-step solutions with expert insights and AI powered tools for academic success
Step: 2
Step: 3
Ace Your Homework with AI
Get the answers you need in no time with our AI-driven, step-by-step assistance