

Question
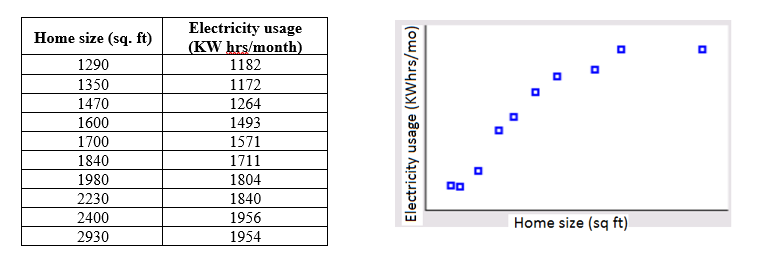
Polynomial Regression The table below shows the electricity consumptions in kilowatt-hours per month from ten houses and the square footage of those houses.The scatter plot
Polynomial Regression
The table below shows the electricity consumptions in kilowatt-hours per month from ten houses and the square footage of those houses.The scatter plot of the data is shown.
Step by Step Solution
There are 3 Steps involved in it
Step: 1

Get Instant Access to Expert-Tailored Solutions
See step-by-step solutions with expert insights and AI powered tools for academic success
Step: 2

Step: 3
Ace Your Homework with AI
Get the answers you need in no time with our AI-driven, step-by-step assistance
Get Started
Mathematical Interest Theory
Authors: Leslie Jane, James Daniel, Federer Vaaler
3rd Edition
147046568X, 978-1470465681