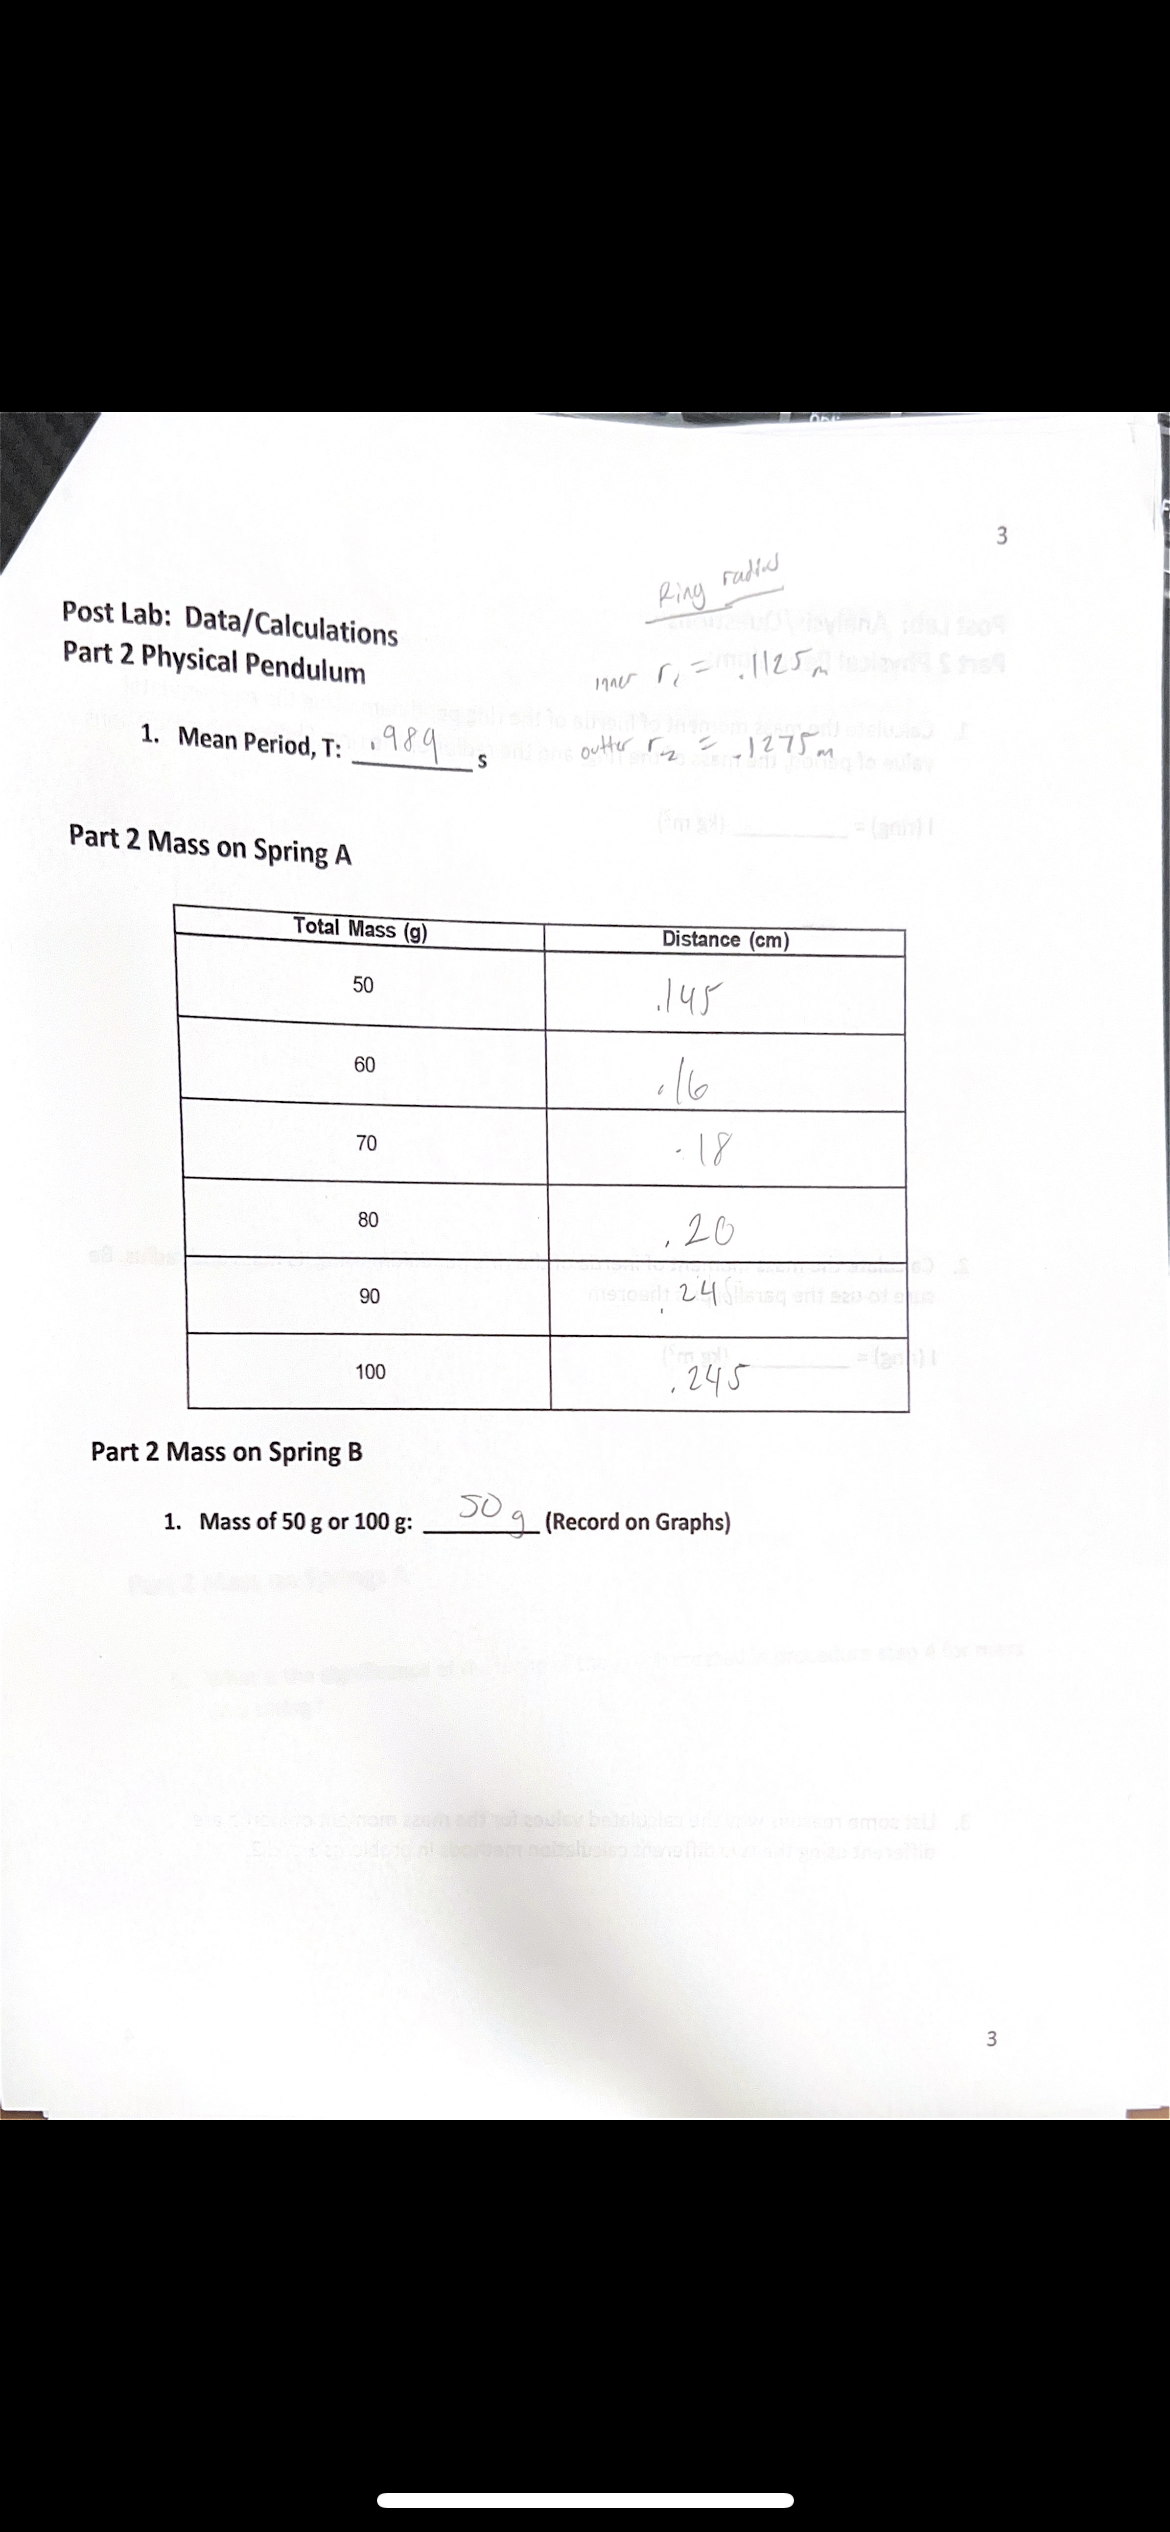
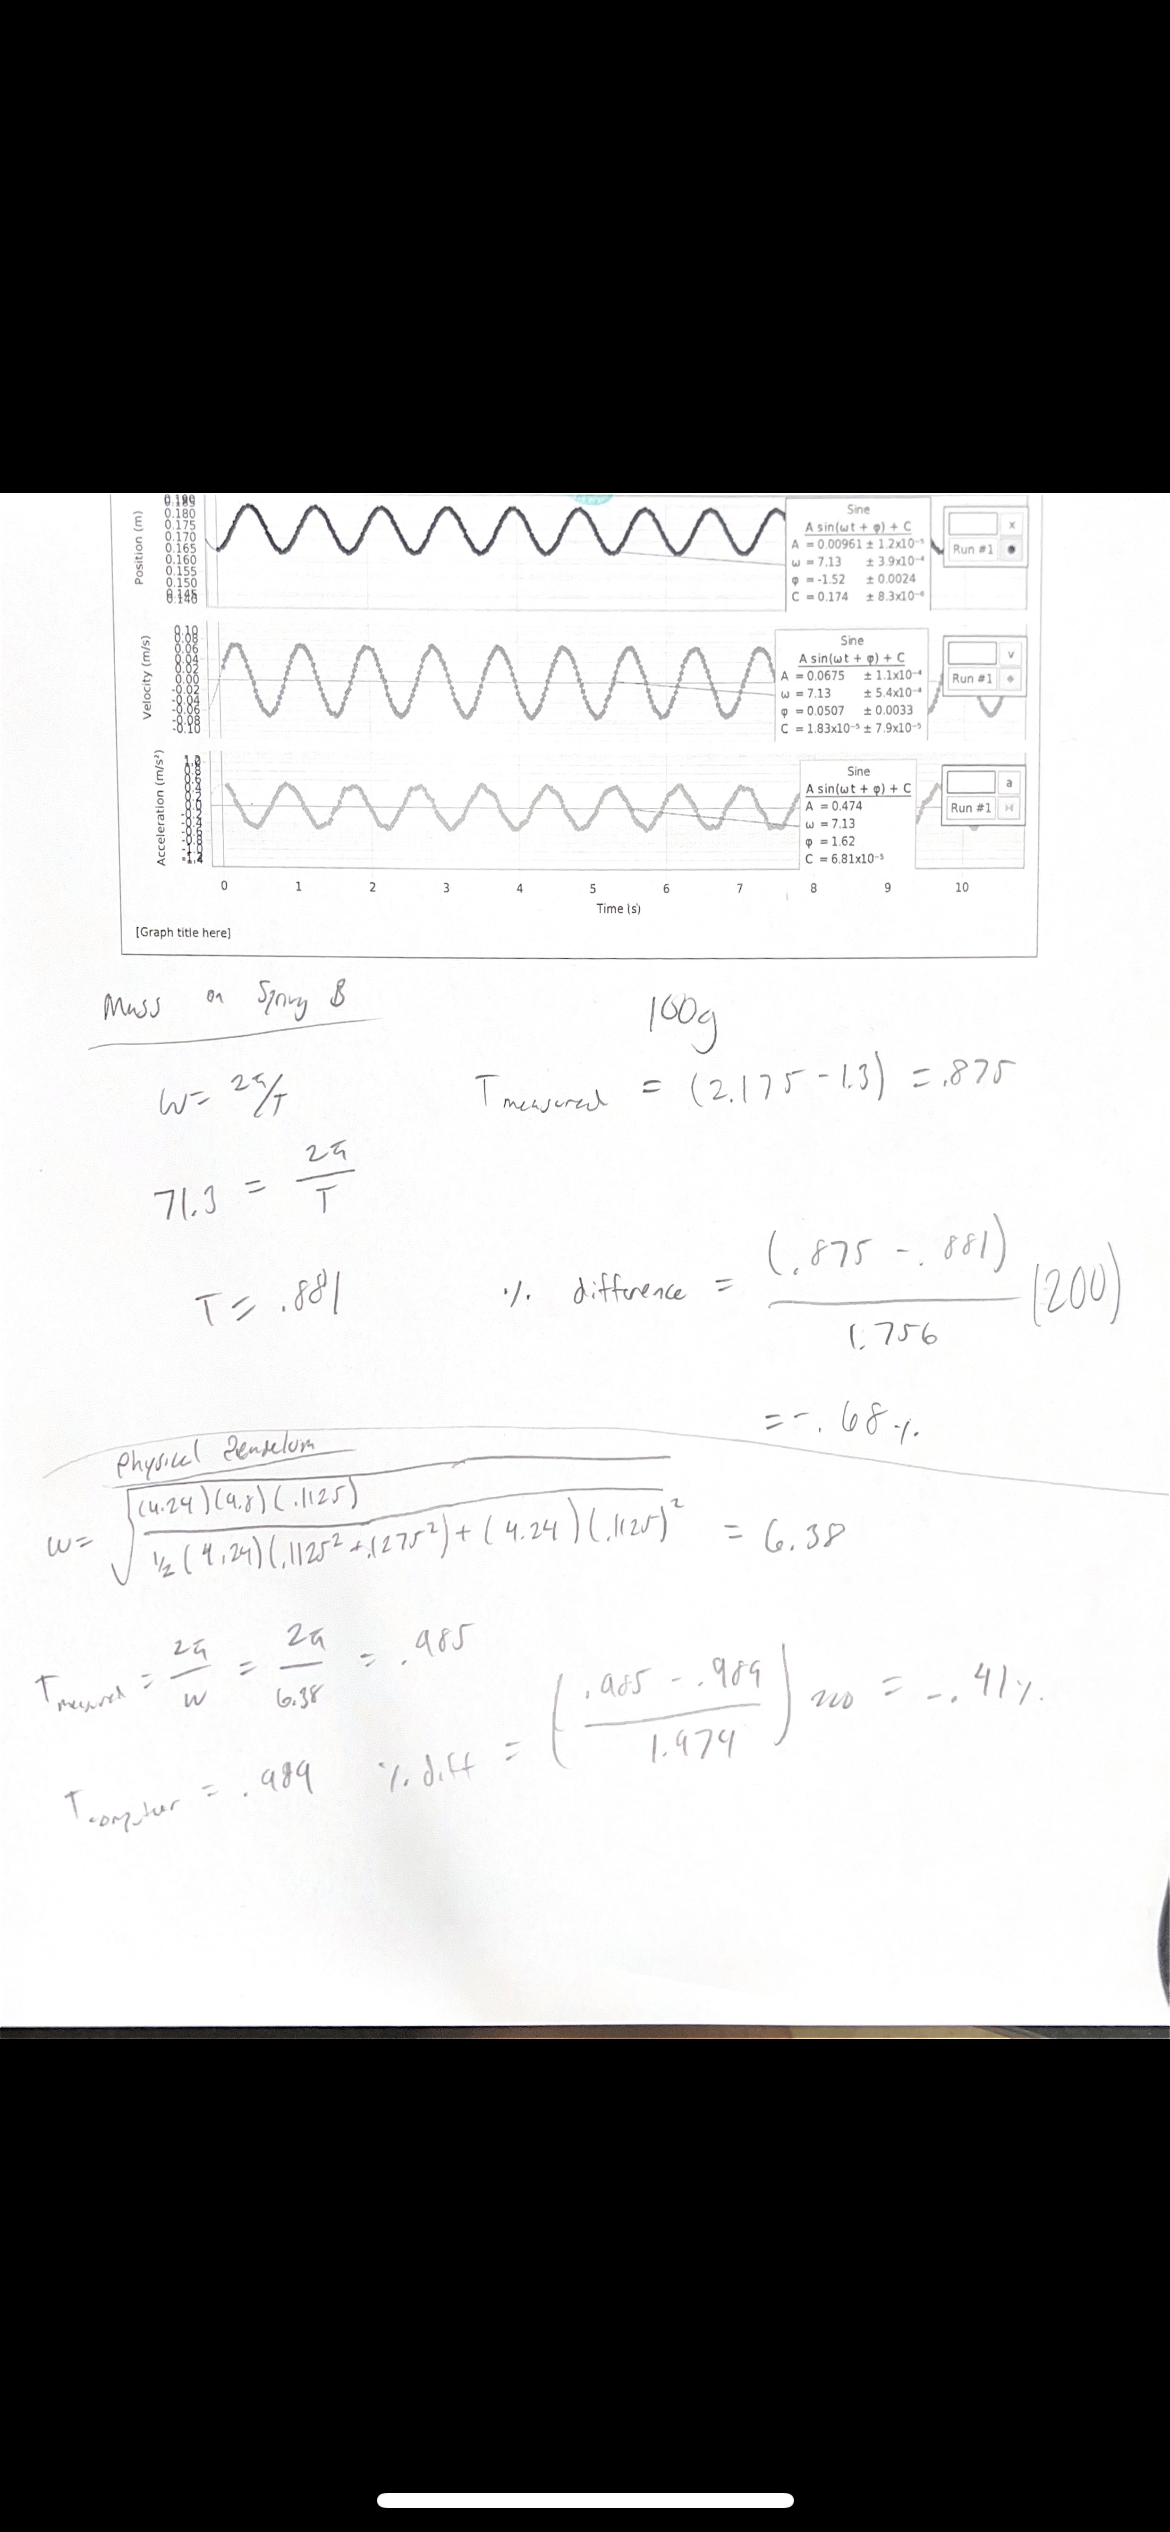
Post Lab: Data/Ca'CUIatiOns , , .,, Part 2 Physical Pandulum WU I. W Y , 1. Mean Farina, HAM mm. (,1 c, '11 '1? 5
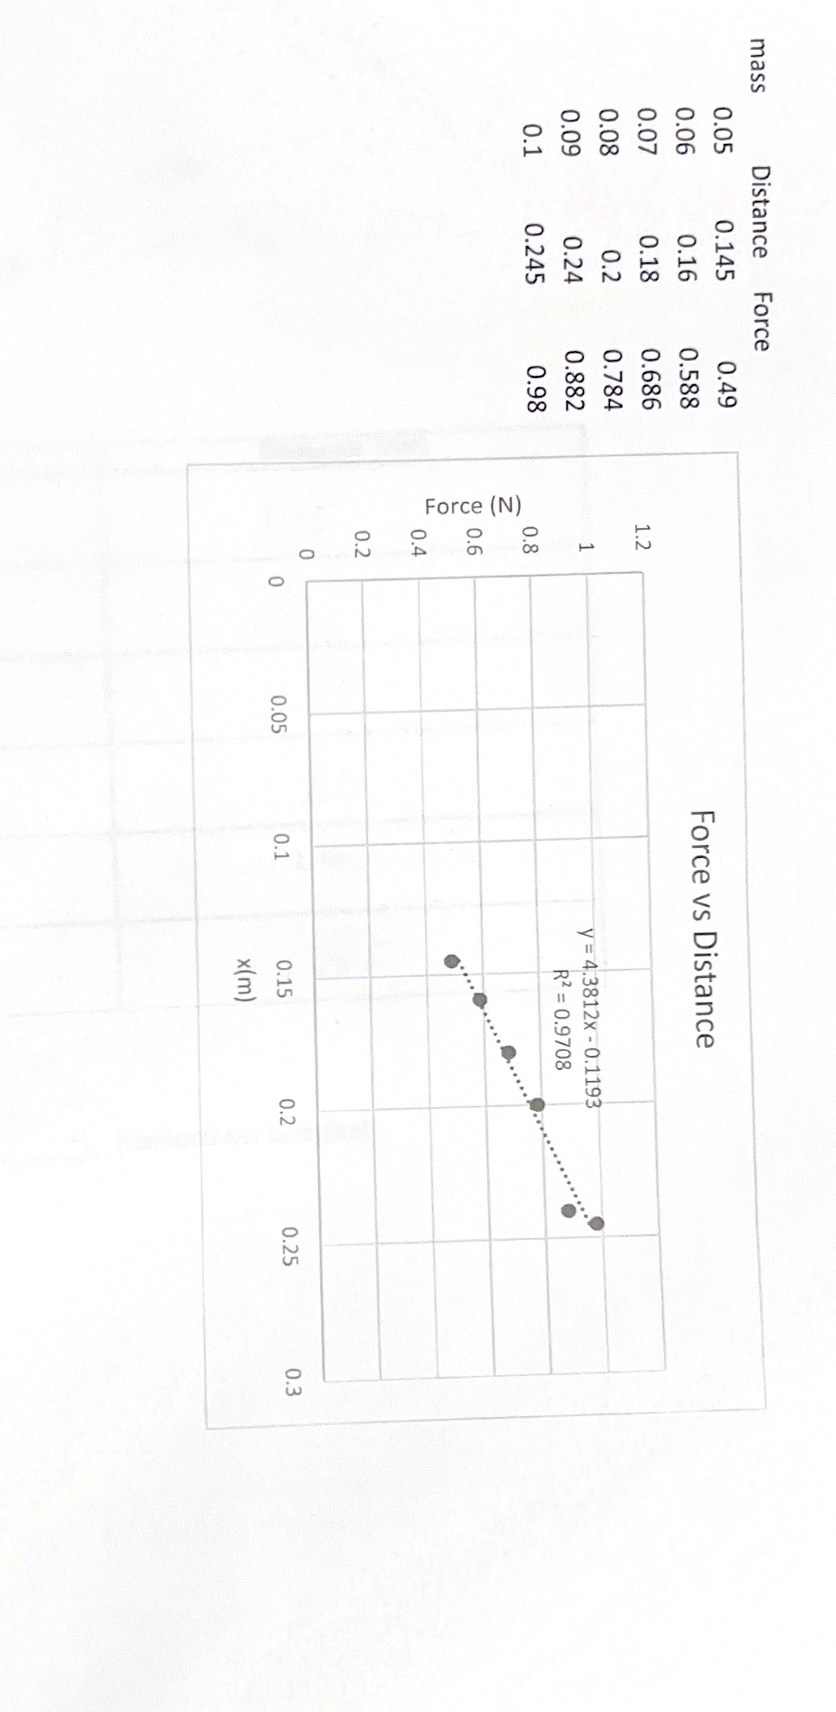
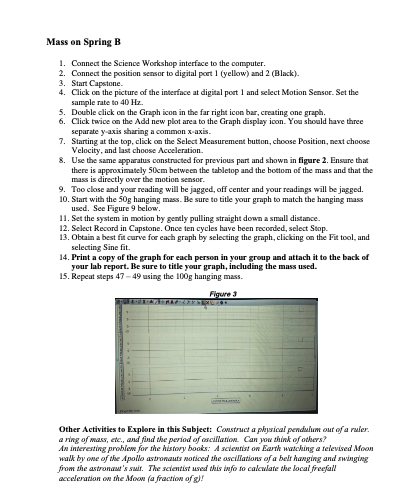
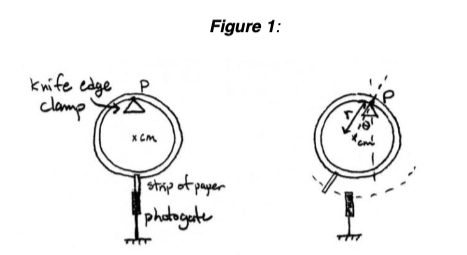
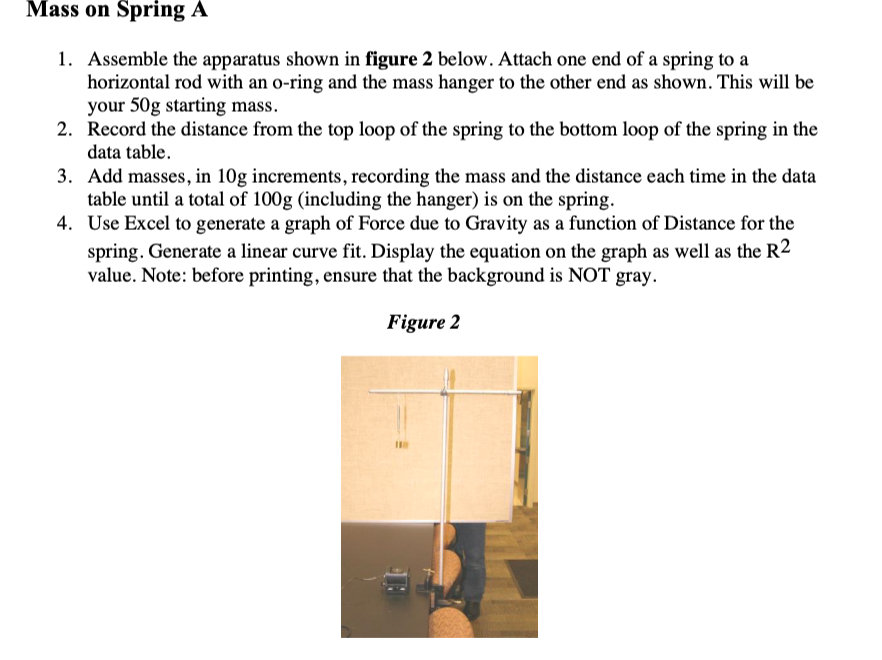
Post Lab: Data/Ca'CUIatiOns , , .,, Part 2 Physical Pandulum WU I. W Y , 1. Mean Farina,\" HAM mm. (,1 c, '11 '1?\" \\5 Part 2 Mass on Spring A Part 2 Mass on Spring B 1. Mass of 50 g or 100 g: 30 3 [Record on Graphs) Position (m) Sine Sooooooo A sin(wt + 9) + C A = 0.00961 = 1.2x10-" w = 7.13 + 3.9x10- Run # 1 . -1.52 1 0.0024 C = 0.174 + 8.3x10- Sine Velocity (m/s) A sin(wt + ) + C = 0.0675 + 1.1x10⁻⁴ W = 7.13 5.4x10⁻⁴ Run # 1 p = 0.0507 + 0.0033 C = 1.83x10⁻³ + 7.9x10⁻⁵ Acceleration (m/s') Sine A sin(wt + @) + C A = 0.474 w = 7.13 Run # 1 p = 1.62 C = 6.81x10-s [Graph title here] Time (s ) 10 Mass on Sing B 100g 1measured = ( 2. 175 - 13 ) =1875 71.] = 29 T difference ( . 875 - 881 ) (200) 1756 Physical Senselom 2-. 681. (4.24 ) ( 9.8 ) ( . 1125 ) W = 1/2 ( 4, 24 ) (, 1125 2 + ( 275 2 ) + ( 4. 24 ) (. 1125 ) = 6.38 - 985 w 6.38 a5 -. 989 no computer =. 989 7 diff = 1.974mass Distance Force 0.05 0.145 0.49 0.06 0.16 0.588 Force vs Distance 0.07 0.18 0.686 0.08 0.2 0.784 0.09 0.24 0.882 y = 4.3812x - 0.1193 R2 = 0.9708 ................ 0.1 0.245 0.98 Force (N) . . .. O 0.05 0.1 0.15 0.25 x(m)Mass on Spring B 1. Connect the Science Workshop interface to the computer. 2. Connect the position sensor to digital port I (yellow) and 2 (Black). 3. Start Capstone. 4. Click on the picture of the interface at digital port I and select Motion Sensor. Set the sample rate to 40 Hz. 5. Double click on the Graph icon in the far right icon bar, creating one graph. Click twice on the Add new plot area to the Graph display icon. You should have three separate y axis sharing a common x-axis. 7. Starting at the top, click on the Select Measurement button, choose Position, next choose Velocity, and last choose Acceleration. 8. Use the same apparatus constructed for previous part and shown in figure 2. Ensure that there is approximately 50em between the tabletop and the bottom of the mass and that the mass is directly over the motion sensor. 9. Too close and your reading will be jagged, off center and your readings will be jagged. 10. Start with the 50g hanging mass. Be sure to title your graph to match the hanging mass used. See Figure 9 below. 1 1. Set the system in motion by gently pulling straight down a small distance. 12. Select Record in Capstone. Once ten cycles have been recorded, select Stop. 13. Obtain a best fit curve for each graph by selecting the graph, clicking on the Fit tool, and selecting Sine fit. 14. Print a copy of the graph for each person in your group and attach it to the back of your lab report. Be sure to title your graph, including the mass used. 15. Repeat steps 47 - 49 using the 100g hanging mass. Figure Other Activities to Explore in this Subject: Construct a playsical pendulum out of a ruler. a ring of mass, etc., and find the period of cacilation Can you think of others? An interesting problem for the history books: A scientist on Earth watching a televised Moon walk by one of the Apollo astronauts noticed the oscillations of a belt hanging and swinging from the astronaut's suit. The scientist used this tofe to calculate the local freefall acceleration on the Moon (a fraction ofg)!1. Calculate the mass moment of inertia of the ring pendulum using the experimental value of period, the mass of the ring, and the radius of the ring. Show your calculations. I (ring) = (kg m?) 2. Calculate the mass moment of inertia of the ring pendulum using its mass and radius. Be sure to use the parallel axis theorem I (ring) = (kg m?) 3. List some reasons why the calculated values for the mass moment of inertia are different using the two different calculation methods in problems 1 and 2.4. If instead you constructed a physical pendulum in the shape of a rectangle with the same mass and recorded the oscillations while it was suspended from one of the corners, how different would the period of oscillation be compared to the ring you used? Sketch showing where the CG should be and show the moment of inertia differences that should change the dynamics. Part 2 Mass on Springs A 5. What is the significance of the slope of the graph created in procedure step 4 for mass on a spring?Part 2 Mass on Springs B 6. Using your graphs, estimate the period for the spring - mass system for the two different masses. Determine the theoretical period for the spring - mass system using the value for hung mass and the value obtained from previous question. Lastly, compute the % difference between the two periods. Show sample calculations and complete the table below. Total Hung Maas (2g)] Parled[via graph ]3) Parled (via chiozo] * Difference7. Determine the theoretical angular frequency (w) of each spring - mass system using the mass and the spring constant. Show your calculation. 8. Determine the experimental angular frequency (@) from the graph by comparing the best fit equation that you generated to x =xmax cos(w t + @). 9. List some reasons why the calculated values for the angular frequency are different using the two different calculation methods in the two previous questions. 10. Compare the graphs for position, velocity, and acceleration. Qualitatively, when the position is at an extreme, what are the values of velocity and acceleration?Physical Pendulum 1. Obtain the knife edge clamp, metal ring, table clamp, photogate, and rod. 2. Fasten the knife edge clamp to the table and place the ring on it. Tape a narrow piece of paper to the bottom of the ring and arrange the photogate so the paper passes through it. See figure 1. 3. Connect the photogate to the interface at digital port 1. 4. Open Capstone 5. Click on the picture of the interface at digital port 1 and select Pendulum Timer. 6. Use the Table icon in the far right icon bar to create a table for recording the Period of the physical pendulum. 7. Place the photogate as shown in figure 1 below. 8. Displace the ring by a small angle and release. 9. Select Record in Capstone. 10. Select Stop after at least ten oscillations have occurred. 11. Determine the mean value of the period (by using the _ icon) and record it in the data table.\fMass on Spring A 1. Assemble the apparatus shown in gure 2 below. Attach one end of a spring to a horizontal rod with an o-ring and the mass hanger to the other end as shown. This will be your 50g starting mass. Record the distance from the top loop of the spring to the bottom loop of the spring in the data table. . Add masses, in 10g increments, recording the mass and the distance each time in the data table until a total of 100g (including the hanger) is on the spring. Use Excel to generate a graph of Force due to Gravity as a function of Distance for the spring. Generate a linear curve fit. Display the equation on the graph as well as the R2 value. Note: before printing, ensure that the background is NOT gray. Figure 2
Step by Step Solution
There are 3 Steps involved in it
Step: 1
Get Instant Access to Expert-Tailored Solutions
See step-by-step solutions with expert insights and AI powered tools for academic success
Step: 2
Step: 3
Ace Your Homework with AI
Get the answers you need in no time with our AI-driven, step-by-step assistance