

Question
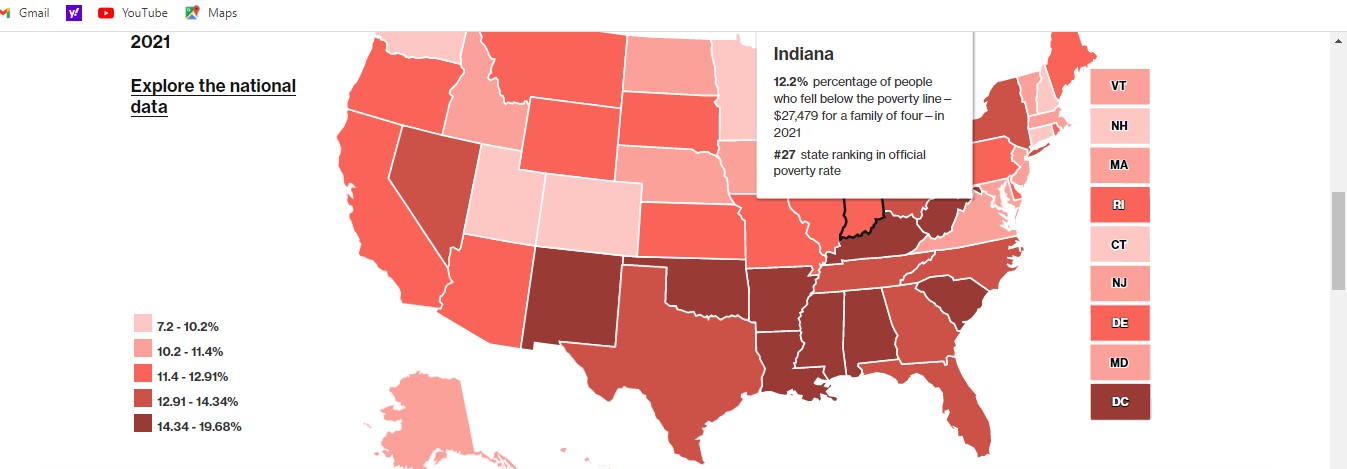
Poverty in Indiana Poverty Data and then select Indiana in the dropdown under the Poverty in the United States: explore the Data header. Examine the
Poverty in Indiana
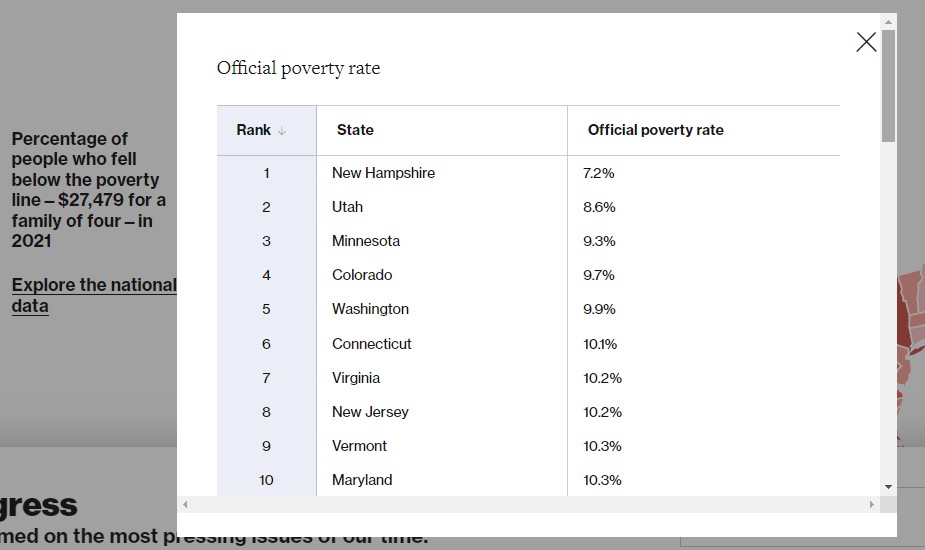
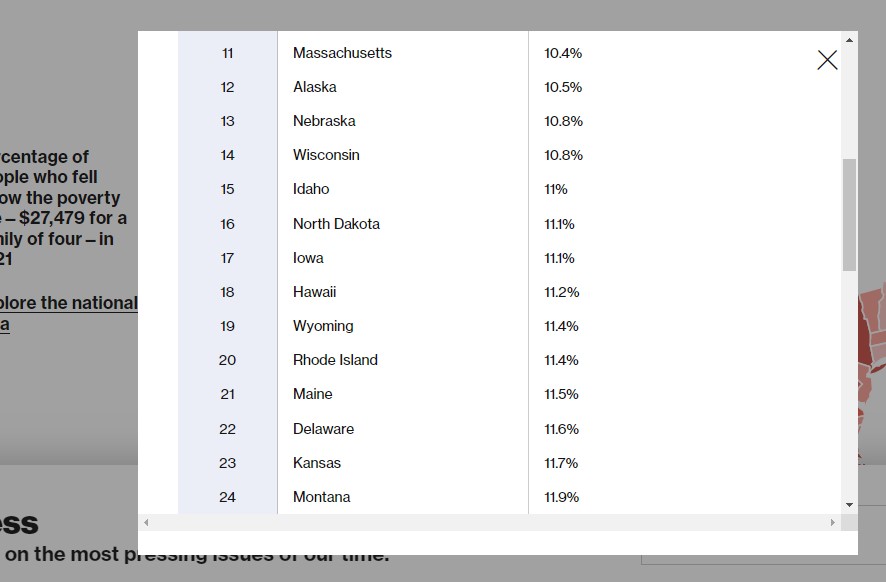
"Poverty Data" and then select Indiana in the dropdown under the "Poverty in the United States: explore the Data" header. Examine the data indicators that come up. You can click on individual indicators to compare Indiana to other states in the U.S. You can also use Indiana's ranking for each indicator. A ranking of 1-16 means Indiana is in the top 1/3 of states for this indicator, meaning they are doing well on this measure. A ranking of 32-50 means Indiana is in the bottom 1/3 of states for the indicator, meaning they are doing poorly on this measure.
- Which indicators put Indiana in the bottom 1/3 of states in the U.S.?
- Which place Indiana in the top 1/3 of states?
- Using your sociological imagination,choose two indicators(from the data on the webpage) from Indiana's poverty data that you think are the most important for Indiana's leaders to focus on to address poverty and its effects on the state. Why are these indicators important? How will they affect the overall poverty rate?
Please Incorporate 2-3 of the following terms bold font:poverty, stratification, feminization of poverty, social mobility, equality of opportunity.


Step by Step Solution
There are 3 Steps involved in it
Step: 1

Get Instant Access to Expert-Tailored Solutions
See step-by-step solutions with expert insights and AI powered tools for academic success
Step: 2

Step: 3
Ace Your Homework with AI
Get the answers you need in no time with our AI-driven, step-by-step assistance
Get Started
Trigonometry
Authors: Ron Larson, Rosemarie Menager Beeley, Larson/Hostetler
8th Edition
1111789177, 9781111789176