

Answered step by step
Verified Expert Solution
Question
1 Approved Answer
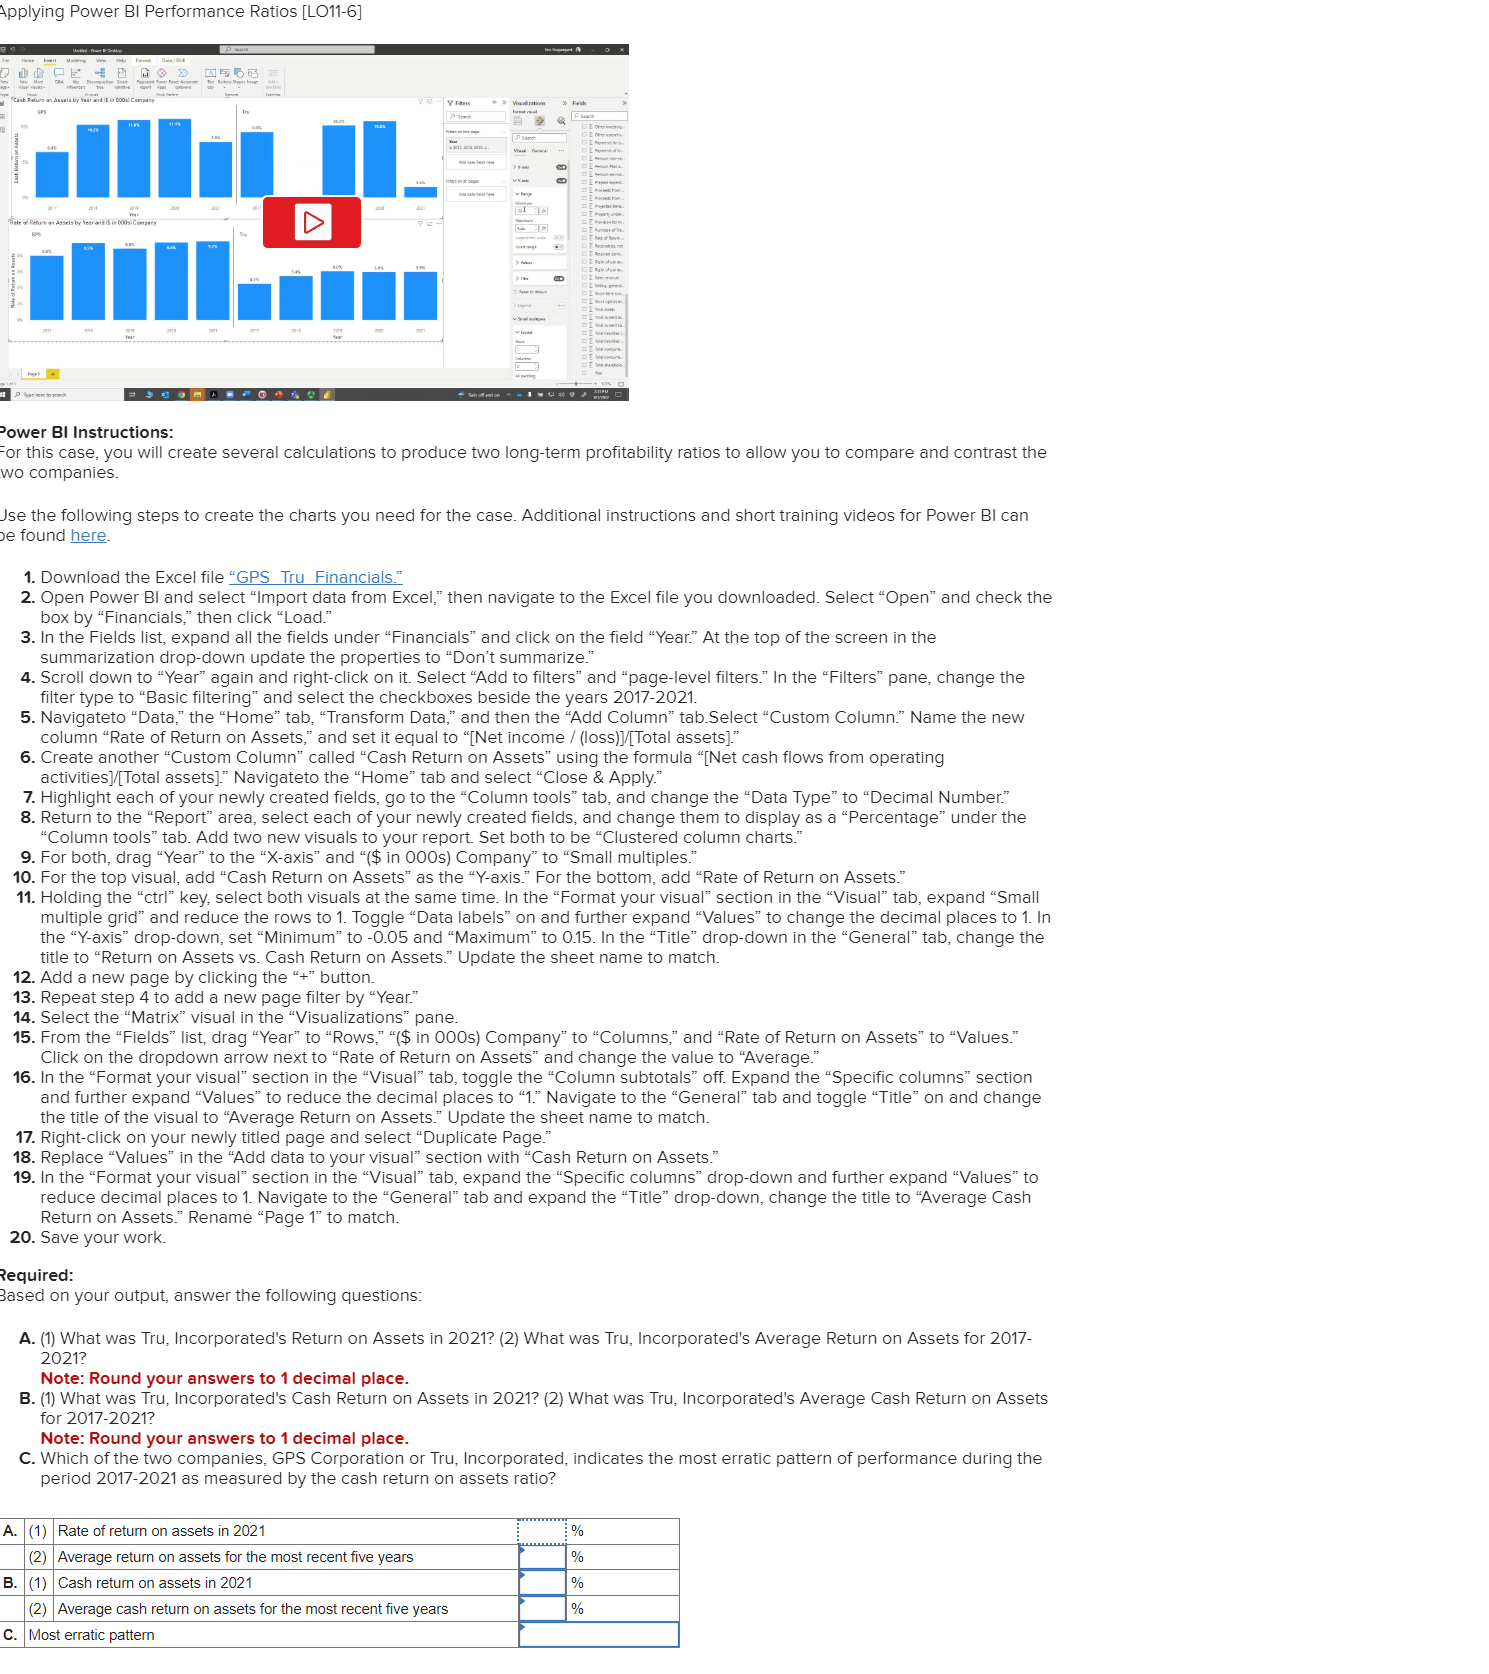
Power BI Instructions: For this case, you will create several calculations to produce two long - term profitability ratios to allow you to compare and
Power BI Instructions:
For this case, you will create several calculations to produce two longterm profitability ratios to allow you to compare and contrast the
wo companies.
Jse the following steps to create the charts you need for the case. Additional instructions and short training videos for Power BI can
found here.
Download the Excel file GPS Tru Financials."
Open Power BI and select "Import data from Excel," then navigate to the Excel file you downloaded. Select "Open" and check the
box by "Financials," then click "Load."
In the Fields list, expand all the fields under "Financials" and click on the field "Year." At the top of the screen in the
summarization dropdown update the properties to "Don't summarize."
Scroll down to "Year" again and rightclick on it Select "Add to filters" and "pagelevel filters." In the "Filters" pane, change the
filter type to "Basic filtering" and select the checkboxes beside the years
Navigateto "Data," the "Home" tab, "Transform Data," and then the "Add Column" tab.Select "Custom Column." Name the new
column "Rate of Return on Assets," and set it equal to Net income lossTotal assets
Create another "Custom Column" called "Cash Return on Assets" using the formula Net cash flows from operating
activitiesTotal assets Navigateto the "Home" tab and select "Close & Apply."
Highlight each of your newly created fields, go to the "Column tools" tab, and change the "Data Type" to "Decimal Number."
Return to the "Report" area, select each of your newly created fields, and change them to display as a "Percentage" under the
"Column tools" tab. Add two new visuals to your report. Set both to be "Clustered column charts."
For both, drag "Year" to the Xaxis" and $ in s Company" to "Small multiples."
For the top visual, add "Cash Return on Assets" as the Yaxis." For the bottom, add "Rate of Return on Assets."
Holding the ctrl key, select both visuals at the same time. In the "Format your visual" section in the "Visual" tab, expand "Small
multiple grid" and reduce the rows to Toggle "Data labels" on and further expand "Values" to change the decimal places to In
the Yaxis" dropdown, set "Minimum" to and "Maximum" to In the "Title" dropdown in the "General" tab, change the
title to "Return on Assets vs Cash Return on Assets." Update the sheet name to match.
Add a new page by clicking the button.
Repeat step to add a new page filter by "Year."
Select the "Matrix" visual in the "Visualizations" pane.
From the "Fields" list, drag "Year" to "Rows," $ in OOOs Company" to "Columns," and "Rate of Return on Assets" to "Values."
Click on the dropdown arrow next to "Rate of Return on Assets" and change the value to "Average."
In the "Format your visual" section in the "Visual" tab, toggle the "Column subtotals" off. Expand the "Specific columns" section
and further expand "Values" to reduce the decimal places to Navigate to the "General" tab and toggle "Title" on and change
the title of the visual to "Average Return on Assets." Update the sheet name to match.
Rightclick on your newly titled page and select "Duplicate Page."
Replace "Values" in the "Add data to your visual" section with "Cash Return on Assets."
In the "Format your visual" section in the "Visual" tab, expand the "Specific columns" dropdown and further expand "Values" to
reduce decimal places to Navigate to the "General" tab and expand the "Title" dropdown, change the title to "Average Cash
Return on Assets." Rename "Page to match.
Save your work.
Required:
Based on your output, answer the following questions:
A What was Tru, Incorporated's Return on Assets in What was Tru, Incorporated's Average Return on Assets for
Note: Round your answers to decimal place.
B What was Tru, Incorporated's Cash Return on Assets in What was Tru, Incorporated's Average Cash Return on Assets
for
Note: Round your answers to decimal place.
C Which of the two companies, GPS Corporation or Tru, Incorporated, indicates the most erratic pattern of performance during the
period as measured by the cash return on assets ratio?
Step by Step Solution
There are 3 Steps involved in it
Step: 1

Get Instant Access to Expert-Tailored Solutions
See step-by-step solutions with expert insights and AI powered tools for academic success
Step: 2

Step: 3
Ace Your Homework with AI
Get the answers you need in no time with our AI-driven, step-by-step assistance
Get Started
Managerial Accounting
Authors: Carl S. Warren, William B. Tayler
16th Edition
0357715225, 9780357715222