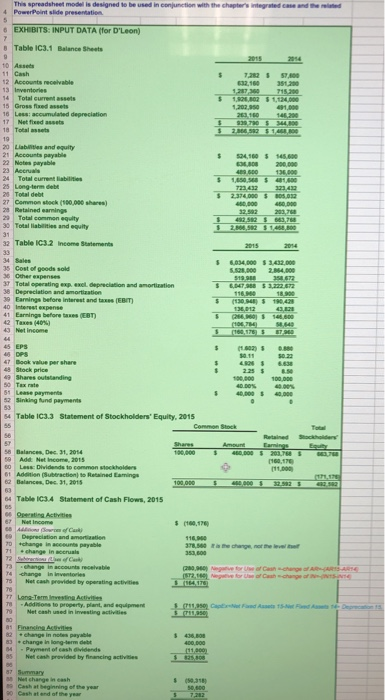
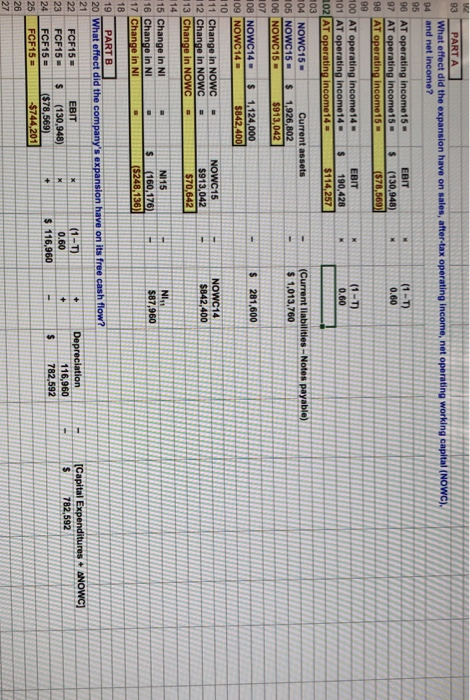
PowerPoint slide presentation EXH BITS: INPUT DATA (for D'Leon) 8 Table IC3.1 Balance Sheets 0 Asseds 32,160 351200 3 Inventories 15 Gross flxed assets 8 Total assets Liablities and equity 21 Accounts payable $24,100 145.60 Notes payable Total eurrent ab 25 Long-term debt 723 432 323 432 805 032 Common stock (180,000 shares) 2 Retained earnings Total common equity 30 Total liabilities and equity 32 Table IC3.2 Income Statements 4 Sales 6.034,000 $3432 000 2.854,000 5 Cost of goods sold 37 Total operating exexel. depreciation and amortization 39 Earnings before interest and taxes (EBIT 41 Earnings betfore taxes (EBT 988 $3,222 672 Taxes (40%) Net income 43 45 EPS 100,000100 000 40,000 40,000 2 Sinking fund payments S4 Table IC3.3 Statement of Stockholders' Equity, 2015 6 | Balance. De-31, 2014 Net Income, 201 160,170 Less: Dividends to 2 Balances, Dec. 31, 2015 4 Table IC3.4 Statement of Cash Flows, 2015 Opernting Activities Net Income 378,560 a the change, not the level he Net cash provided by operating activities te property and squipment Net cash used in Investing activities Payment of eash dividends Net cesh provided by financing activities 85 Net charge i e Cash at beginning of the year (50.318 p4 and net income? 0.60 0.60 05 NOWC15$ 1,926,802 1,124,000 $ 281 NI15 16 Change in NI 17 Change in N 0.60 23 FCF15$(130 24 FCF15 25| FCF15# PowerPoint slide presentation EXH BITS: INPUT DATA (for D'Leon) 8 Table IC3.1 Balance Sheets 0 Asseds 32,160 351200 3 Inventories 15 Gross flxed assets 8 Total assets Liablities and equity 21 Accounts payable $24,100 145.60 Notes payable Total eurrent ab 25 Long-term debt 723 432 323 432 805 032 Common stock (180,000 shares) 2 Retained earnings Total common equity 30 Total liabilities and equity 32 Table IC3.2 Income Statements 4 Sales 6.034,000 $3432 000 2.854,000 5 Cost of goods sold 37 Total operating exexel. depreciation and amortization 39 Earnings before interest and taxes (EBIT 41 Earnings betfore taxes (EBT 988 $3,222 672 Taxes (40%) Net income 43 45 EPS 100,000100 000 40,000 40,000 2 Sinking fund payments S4 Table IC3.3 Statement of Stockholders' Equity, 2015 6 | Balance. De-31, 2014 Net Income, 201 160,170 Less: Dividends to 2 Balances, Dec. 31, 2015 4 Table IC3.4 Statement of Cash Flows, 2015 Opernting Activities Net Income 378,560 a the change, not the level he Net cash provided by operating activities te property and squipment Net cash used in Investing activities Payment of eash dividends Net cesh provided by financing activities 85 Net charge i e Cash at beginning of the year (50.318 p4 and net income? 0.60 0.60 05 NOWC15$ 1,926,802 1,124,000 $ 281 NI15 16 Change in NI 17 Change in N 0.60 23 FCF15$(130 24 FCF15 25| FCF15#


