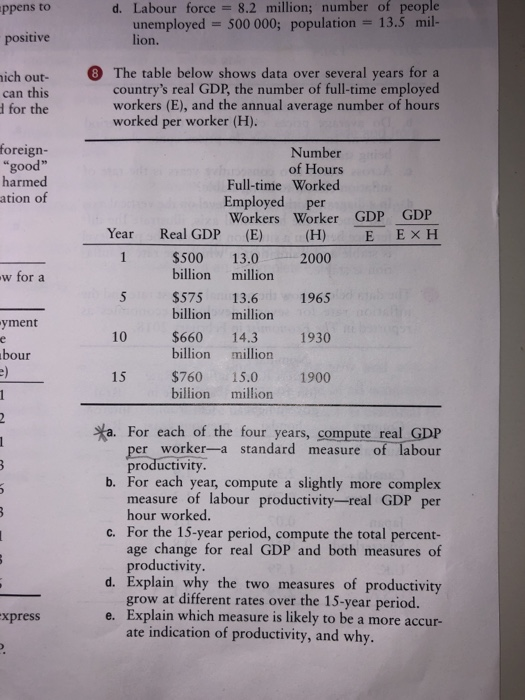
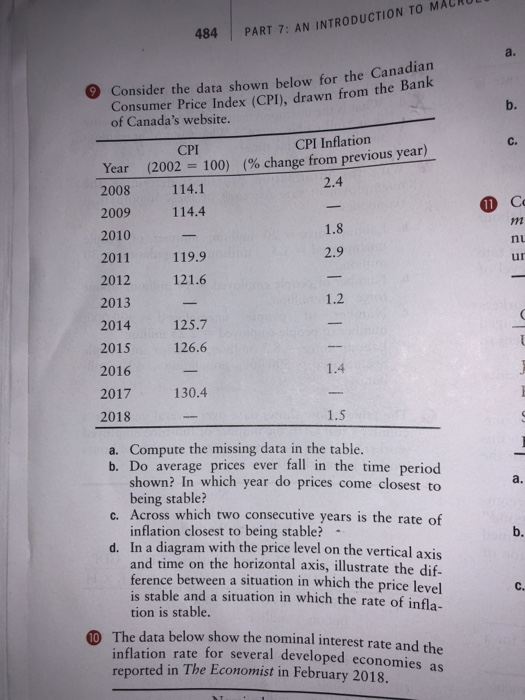
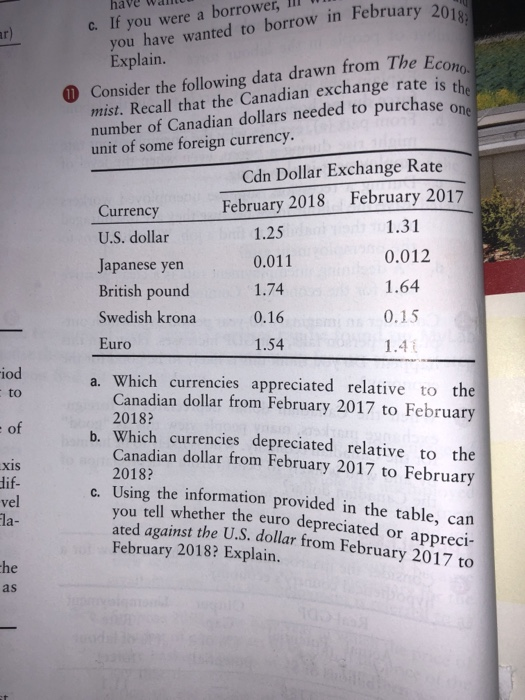
ppens to d. Labour force = 8.2 million; number of people unemployed = 500 000; population = 13.5 mil. lion. positive 8 mich out- can this for the The table below shows data over several years for a country's real GDP, the number of full-time employed workers (E), and the annual average number of hours worked per worker (H). foreign- "good" harmed ation of Year w for a Number of Hours Full-time Worked Employed per Workers Worker GDP GDP Real GDP (E) (H) E EXH $500 13.0 2000 billion million $575 13.6 1965 billion million $660 14.3 1930 billion million $760 15.0 1900 billion million -yment 10 abour a. For each of the four years, compute real GDP per worker-a standard measure of labour productivity. b. For each year, compute a slightly more complex measure of labour productivity-real GDP per hour worked. c. For the 15-year period, compute the total percent- age change for real GDP and both measures of productivity. d. Explain why the two measures of productivity grow at different rates over the 15-year period. e. Explain which measure is likely to be a more accur- ate indication of productivity, and why. xpress 484 PART 7: AN INTRODUCTION TO MACRULT Consider the data shown below for the Canadian Consumer Price Index (CPI), drawn from the B of Canada's website. CPI CPI Inflation Year (2002 = 100) (% change from previous year) 2008 114.1 2009 114.4 2010 2011 119.9 2012 121.6 2013 125.7 126.6 2016 2017 130.4 2018 a. Compute the missing data in the table. b. Do average prices ever fall in the time period shown? In which year do prices come closest to being stable? c. Across which two consecutive years is the rate of inflation closest to being stable?. d. In a diagram with the price level on the vertical axis and time on the horizontal axis, illustrate the dif- ference between a situation in which the price level is stable and a situation in which the rate of infla- tion is stable. 10 The data below show the nominal interest rate and the inflation rate for several developed economies as reported in The Economist in February 2018. II III 2014 2015 have wall ebruary 2018 C. If you were a borrower, III you have wanted to borrow in February 20 Explain. Consider the following data drawn from The Ecom mist. Recall that the Canadian exchange rate is th. number of Canadian dollars needed to purchase on unit of some foreign currency. Currency U.S. dollar Japanese yen British pound Swedish krona Euro Cdn Dollar Exchange Rate February 2018 February 2017 1.25 1.31 0.011 0.012 1.74 1.64 0.16 0.15 1.54 ona 1.4 riod to exis a. Which currencies appreciated relative to the Canadian dollar from February 2017 to February 2018? b. Which currencies depreciated relative to the Canadian dollar from February 2017 to February 2018? Using the information provided in the table, can you tell whether the euro depreciated or a ated against the U.S. dollar from February 2017 to uno depreciated or appreci- February 2018? Explain. Hif. vel