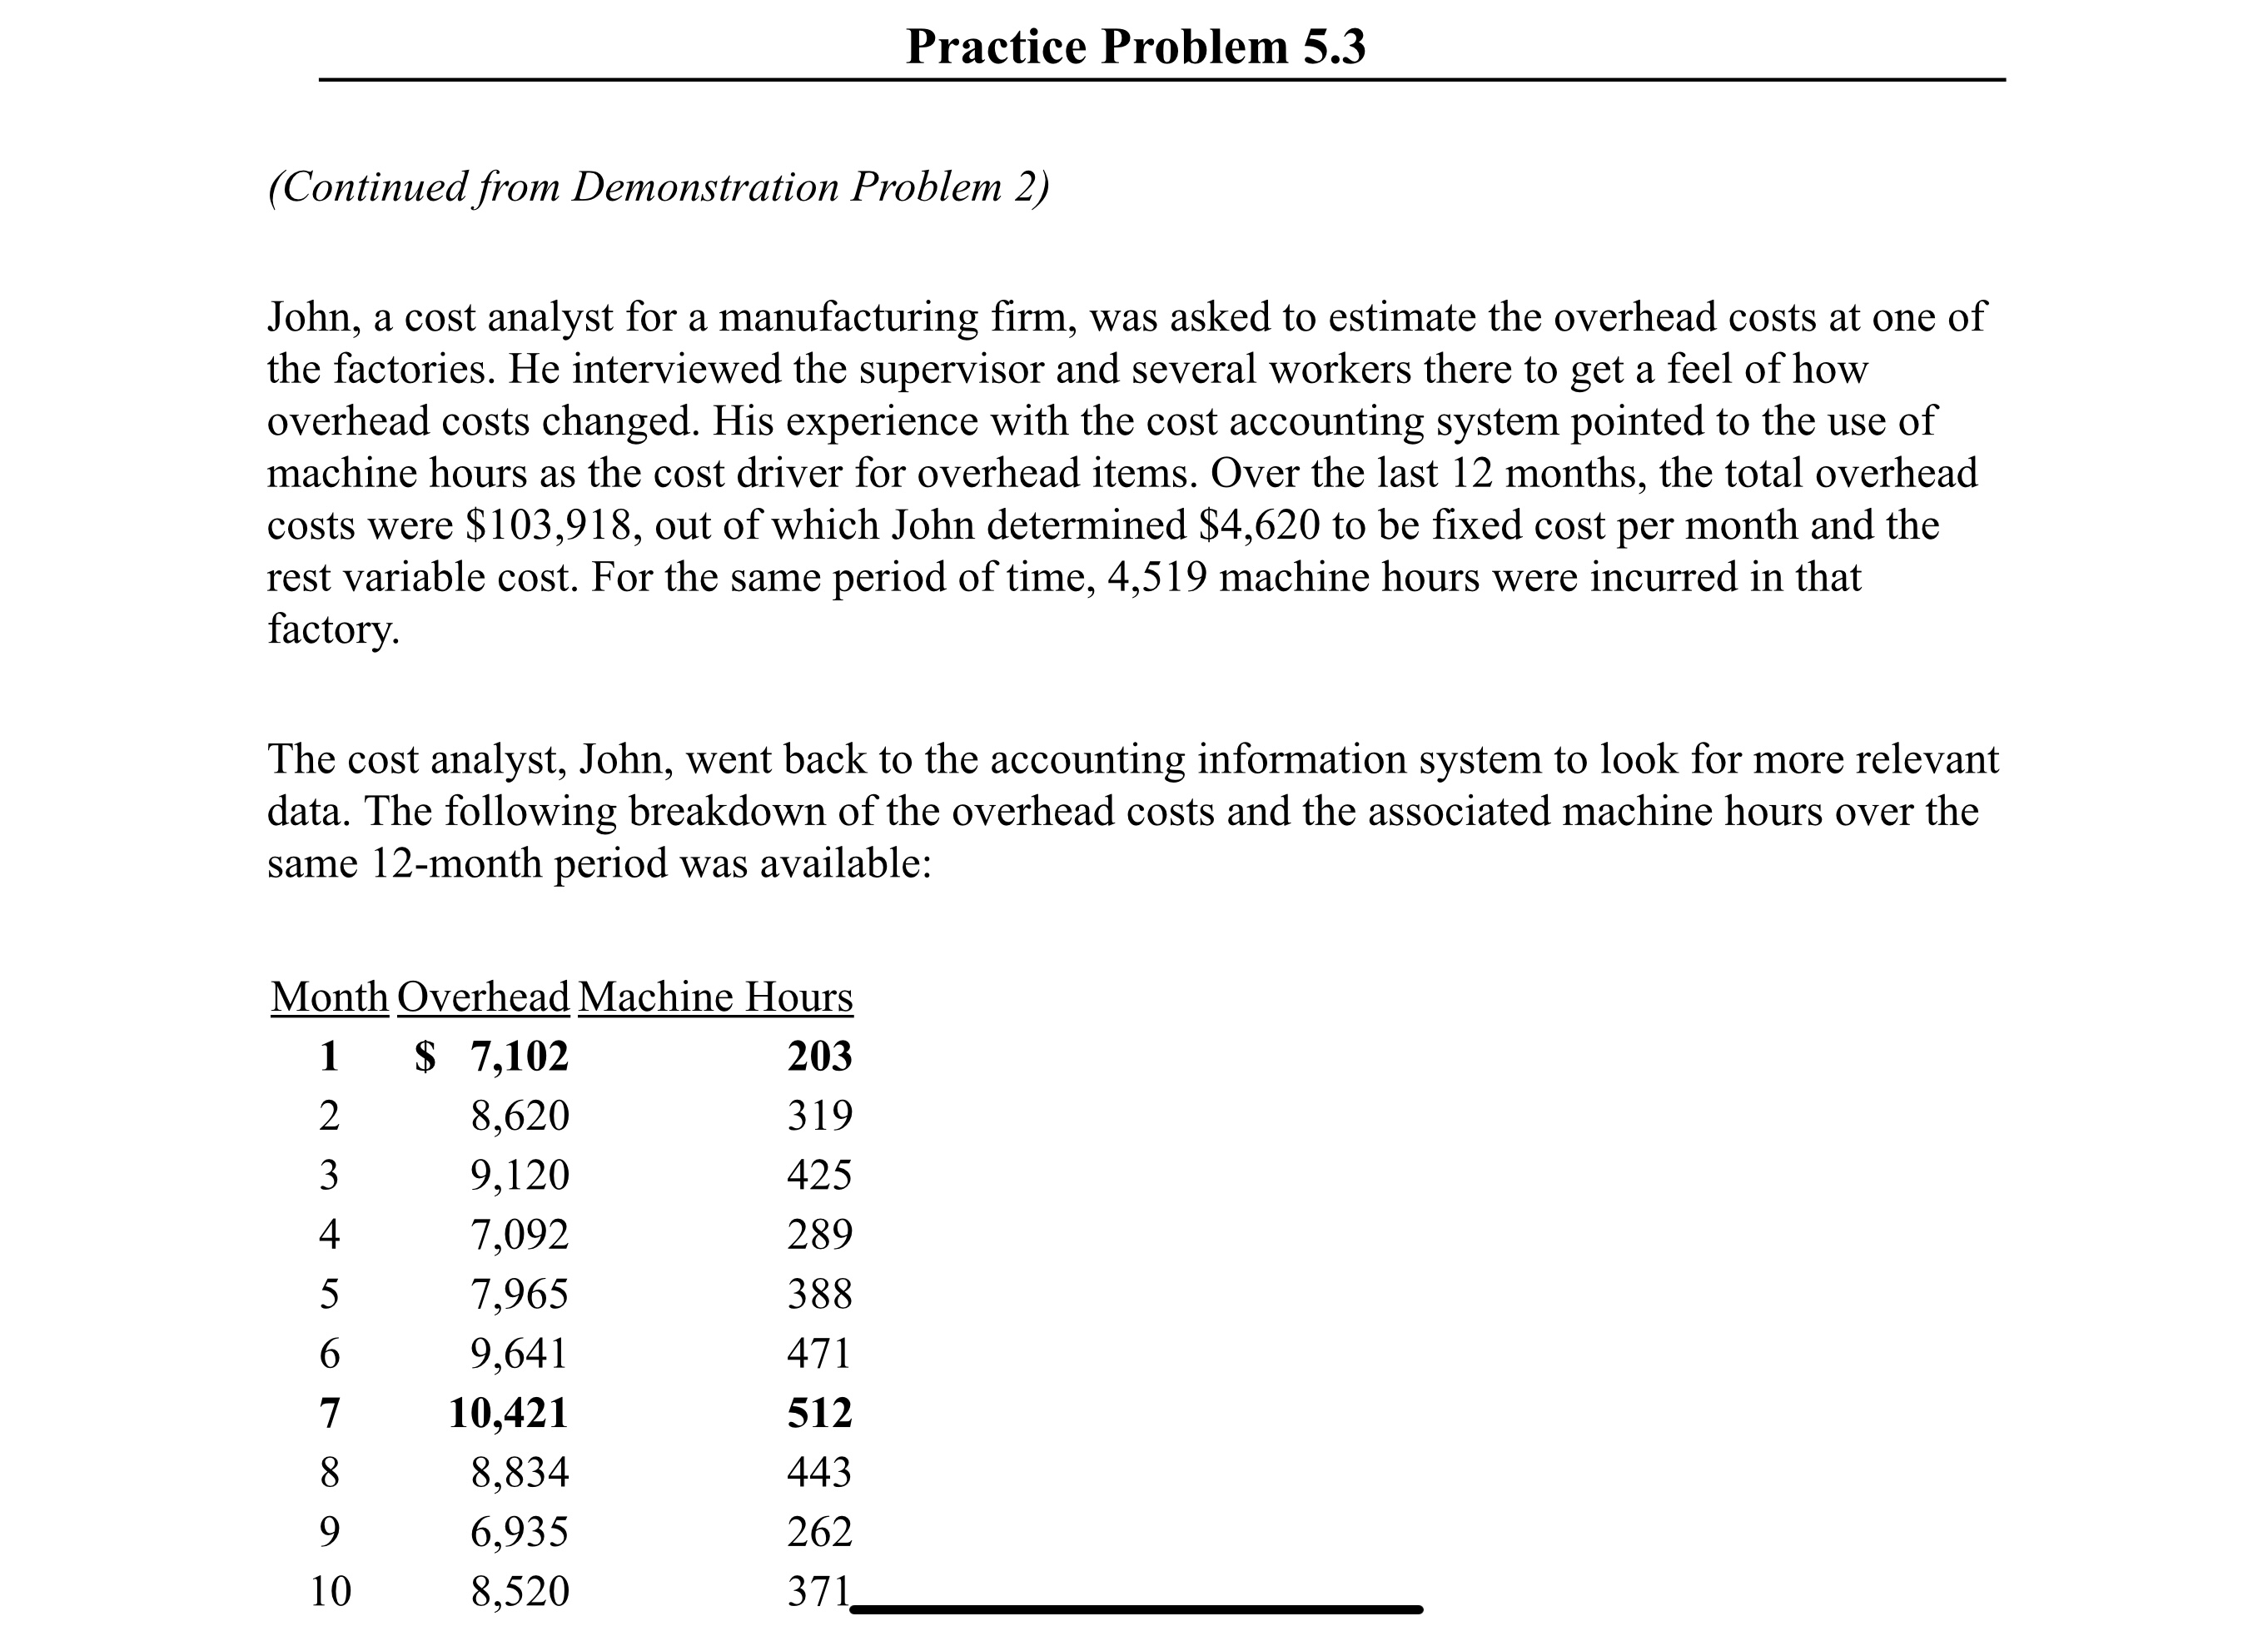
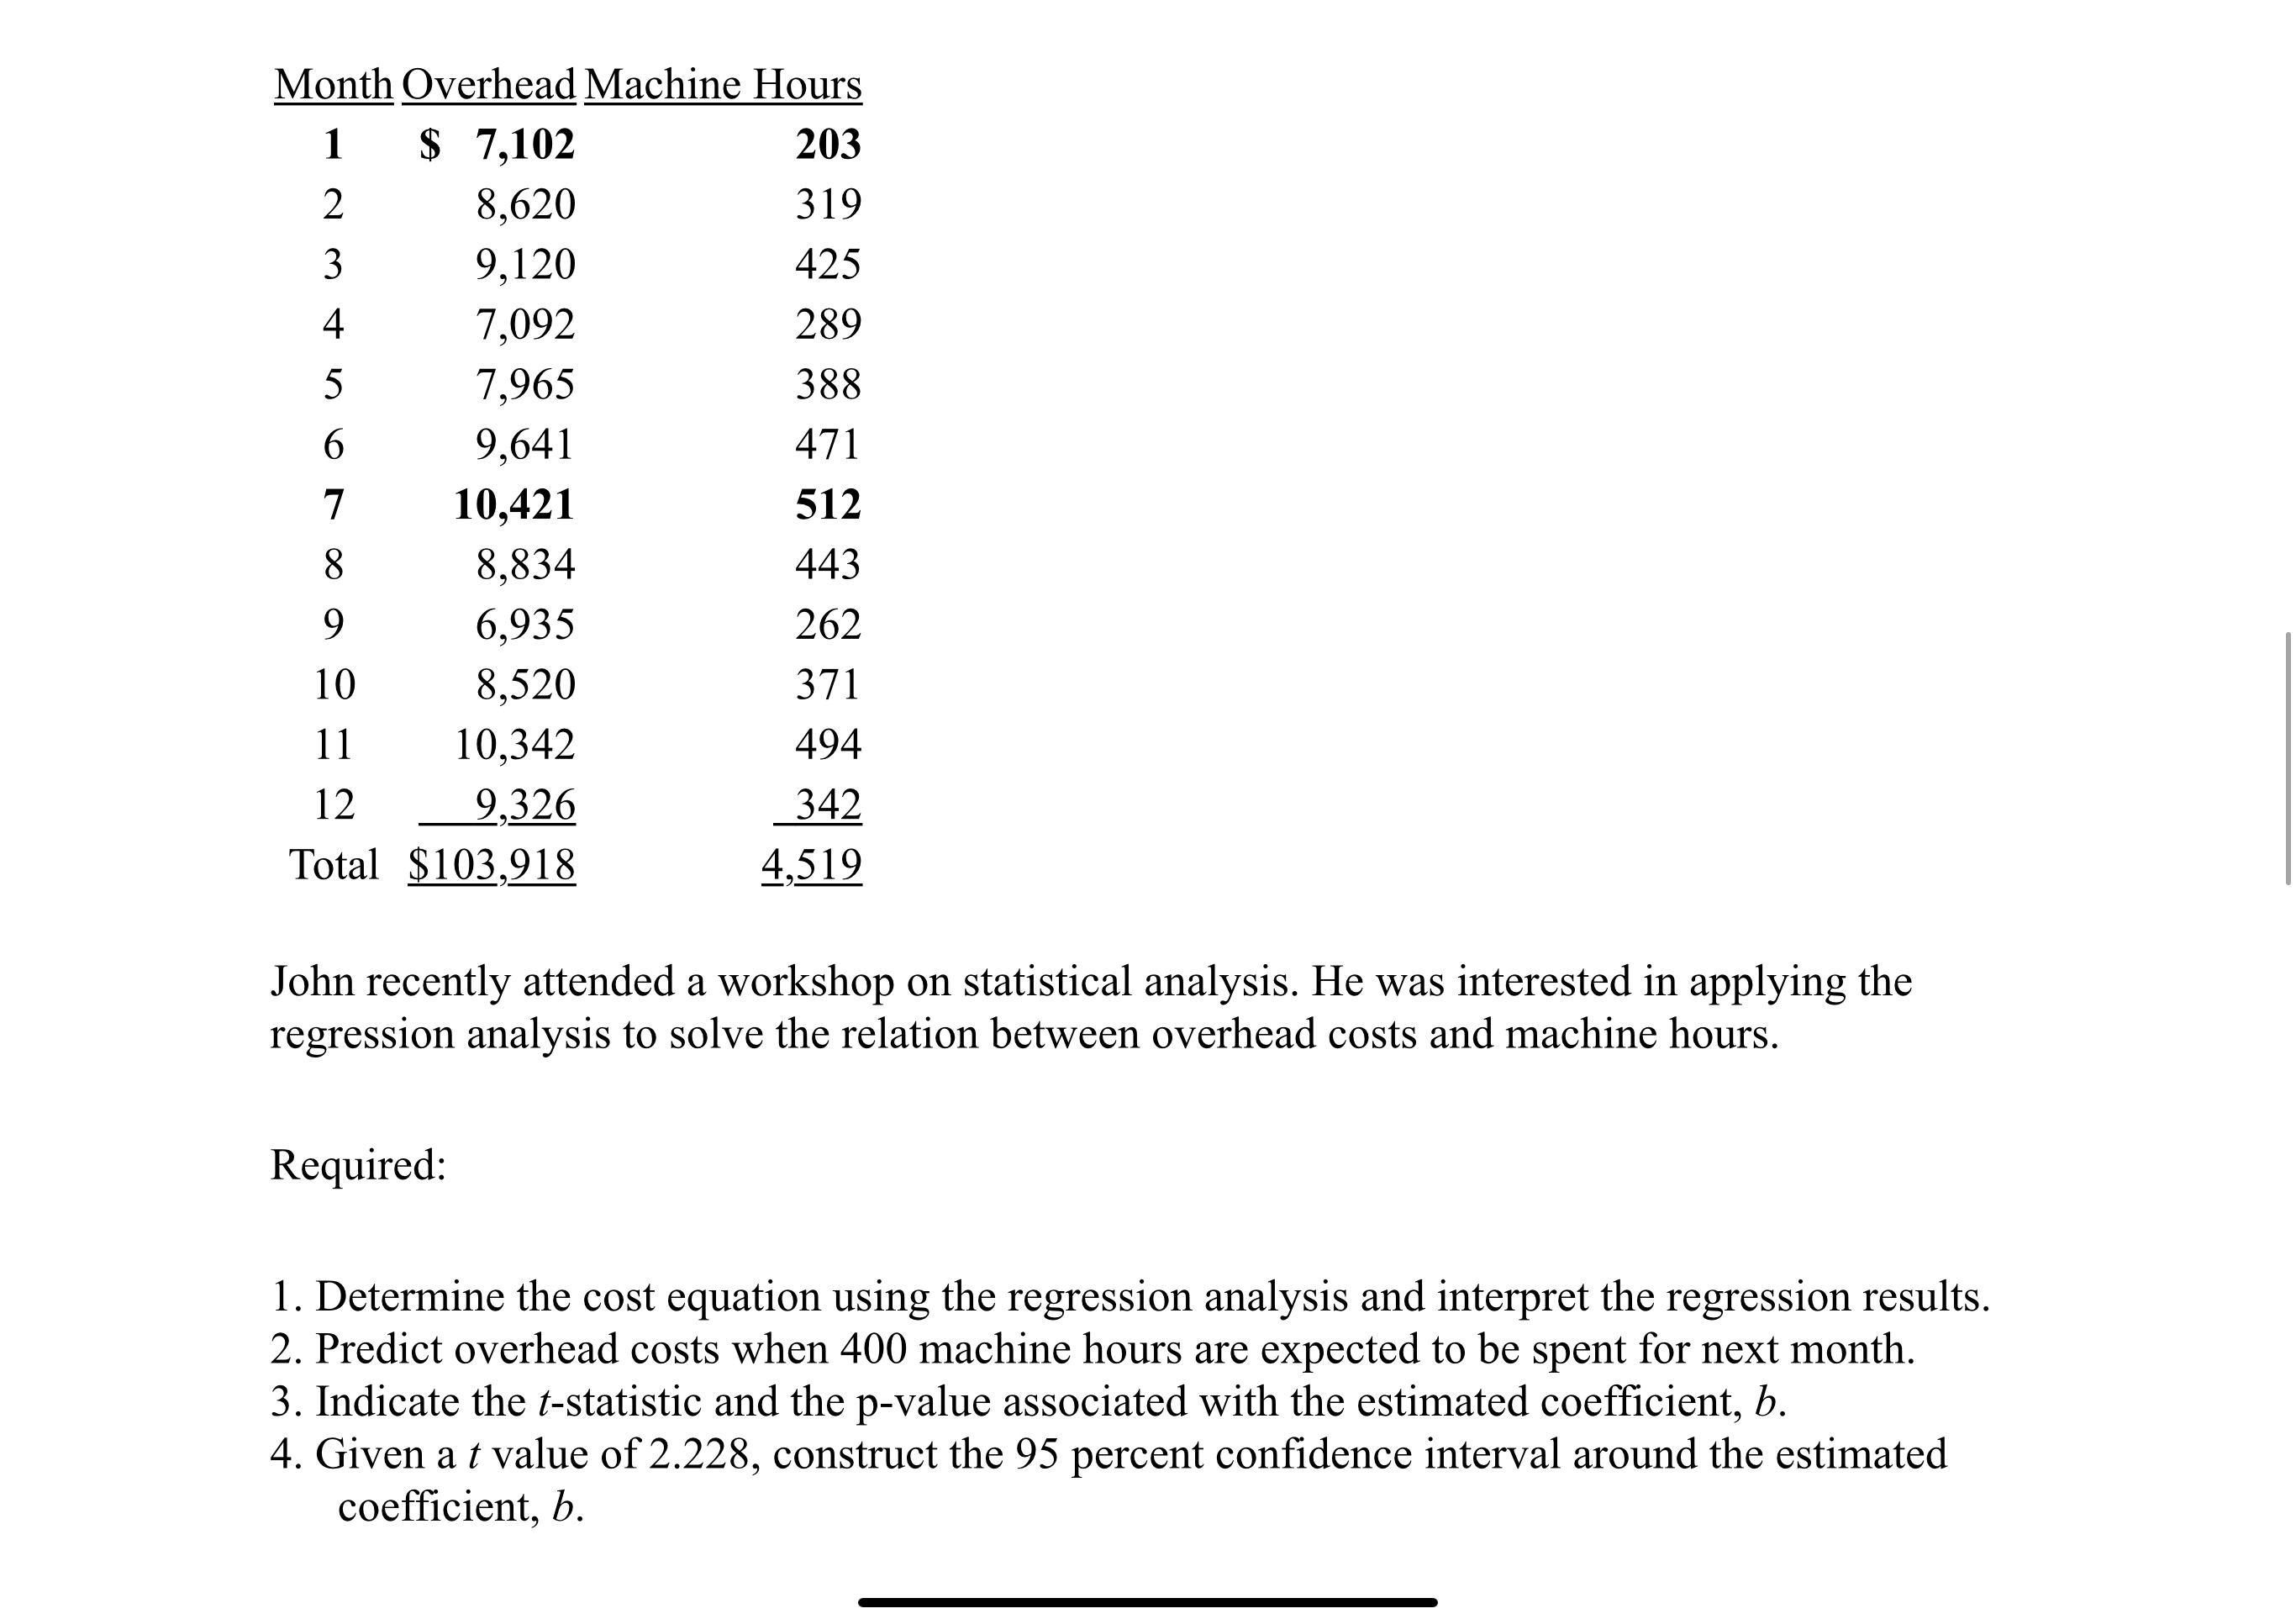
Practice Problem 5.3 (Continued from Demonstration Problem 2) John, a cost analyst for a manufacturing rm, was asked to estimate the overhead costs at one of the factories. He interviewed the supervisor and several workers there to get a feel of how overhead costs changed. His experience with the cost accounting system pointed to the use of machine hours as the cost driver for overhead items. Over the last 12 months, the total overhead costs were $103,918, out of which John determined $4,620 to be xed cost per month and the rest variable cost. For the same period of time, 4,519 machine hours were incurred in that factory. The cost analyst, John, went back to the accounting information system to 100k for more relevant data. The following breakdown of the overhead costs and the associated machine hours over the same 12-month period was available: Month Overhead Machine Hours 1 \\DOOQQUILWN 10 $ 7,102 8,620 9,120 7,092 7,965 9,641 10,421 8,834 6,935 8,520 203 319 425 289 388 471 512 443 262 371 Month Overhead Machine Hours $ 7,102 203 8,620 319 9,120 425 7,092 289 7,965 388 9,641 471 10,421 512 8 8,834 443 9 6,935 262 10 8,520 371 11 10,342 494 12 9,326 342 Total $103,918 4,519 John recently attended a workshop on statistical analysis. He was interested in applying the regression analysis to solve the relation between overhead costs and machine hours. Required: 1. Determine the cost equation using the regression analysis and interpret the regression results. 2. Predict overhead costs when 400 machine hours are expected to be spent for next month. 3. Indicate the t-statistic and the p-value associated with the estimated coefficient, b. 4. Given a t value of 2.228, construct the 95 percent confidence interval around the estimated coefficient, b