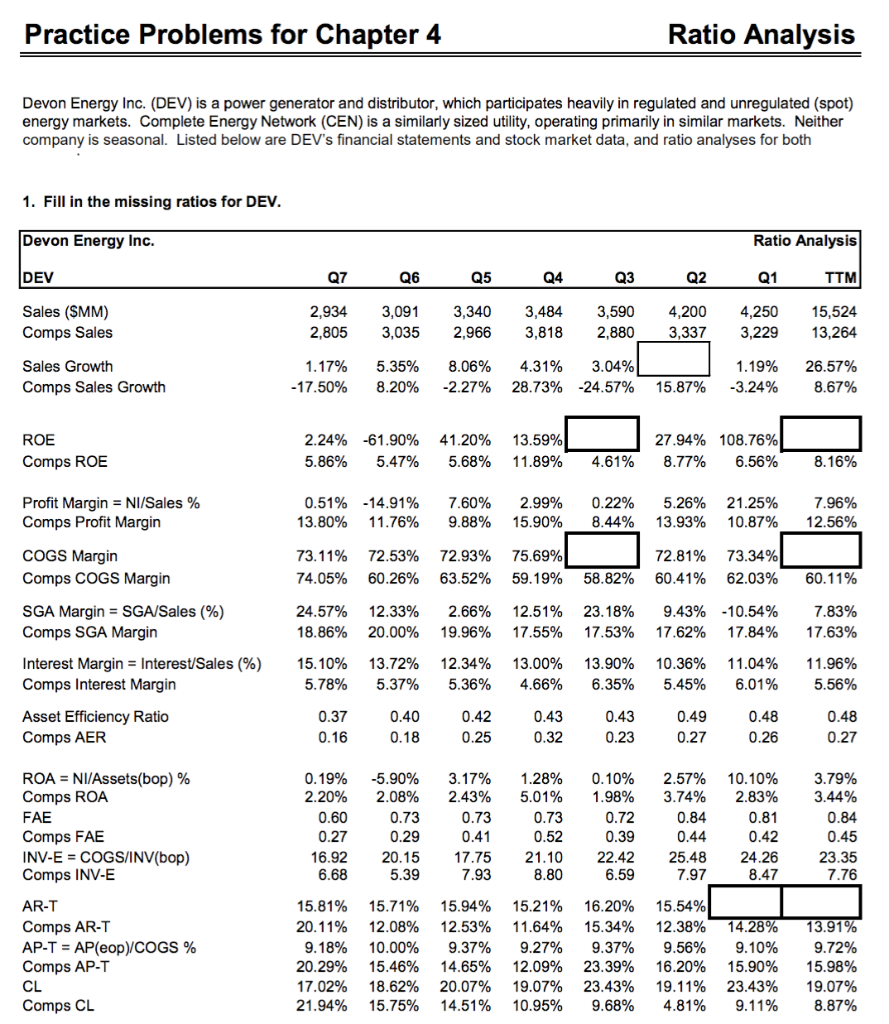
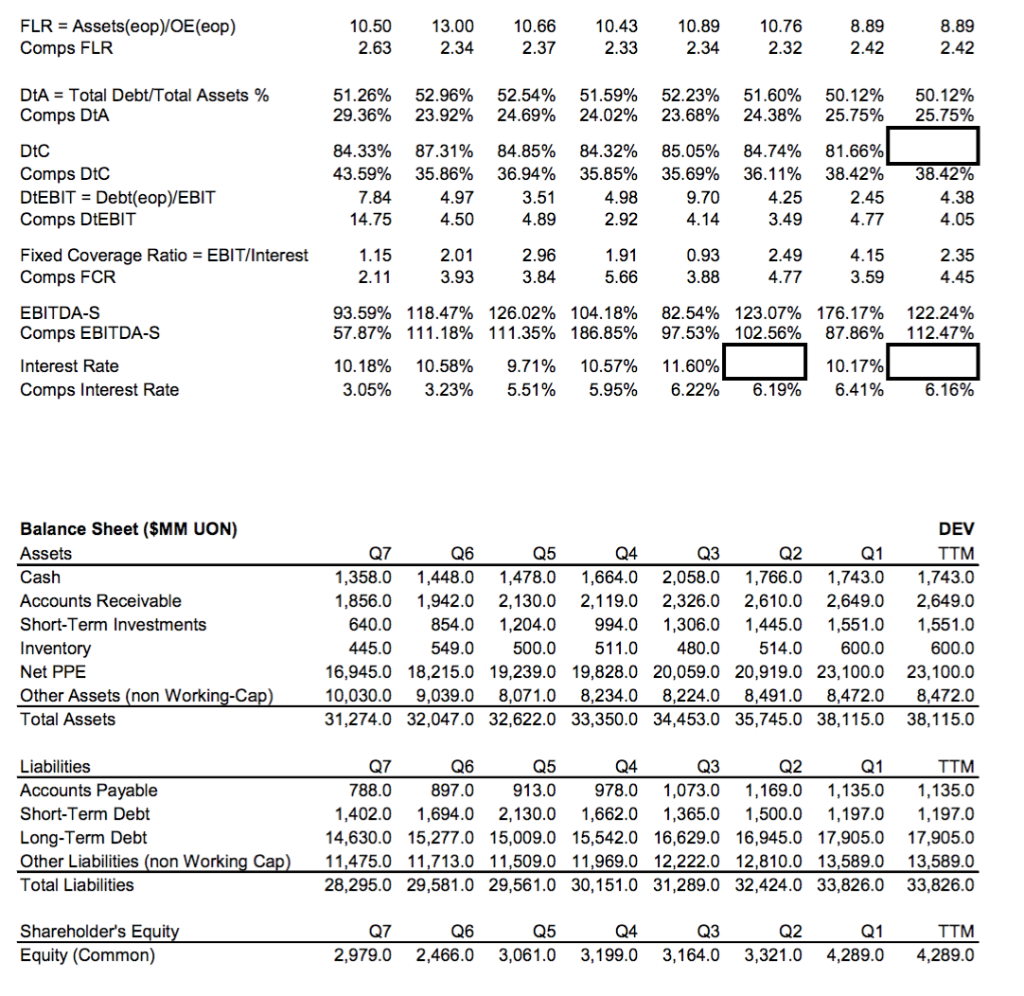
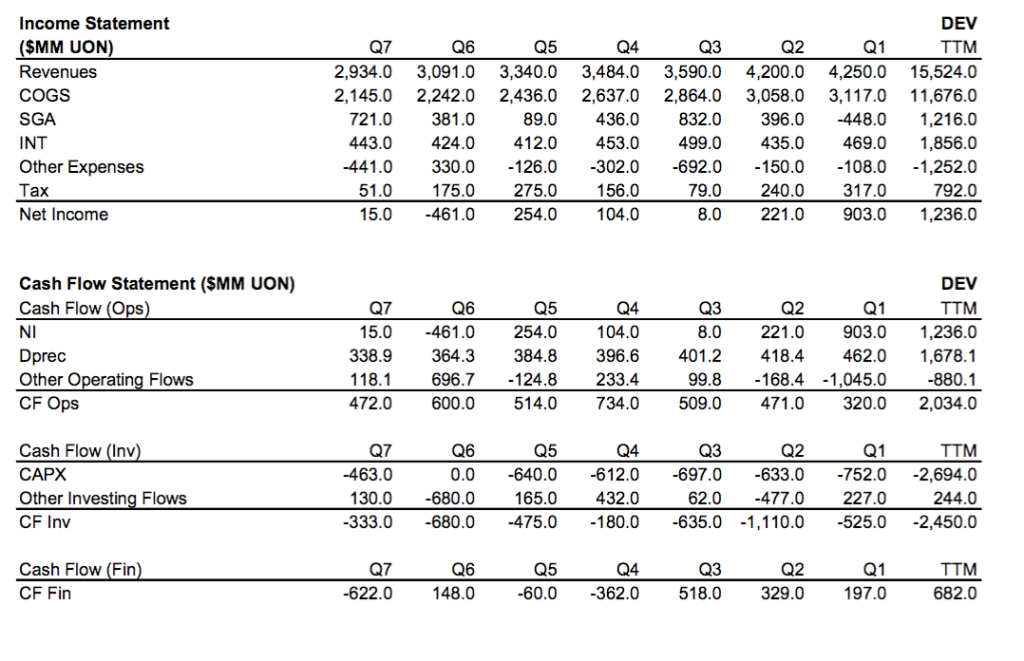
Practice Problems for Chapter 4 Ratio Analysis Devon Energy Inc. (DEV) is a power generator and distributor, which participates heavily in regulated and unregulated (spot) energy markets. Complete Energy Network (CEN) is a similarly sized utility, operating primarily in similar markets. Neither company is seasonal. Listed below are DEV's financial statements and stock market data, and ratio analyses for both 1. Fill in the missing ratios for DEV. Devon Energy Inc. DEV Sales (SMM) Comps Sales Sales Growth Comps Sales Growth Ratio Analysis 2,9343,091 3,340 3,484 3,590 4,200 4,25015,524 Q7 Q4 Q2 2,805 3,0352,966 3,818 2,8803,3373,229 13,264 1.17% -17.50% 5.35% 8.20% 8.06% -2.27% 4.31% 28.73% 3.04% -24.57% 1.19% -3.24% 26.57% 15.87% 8.67% ROE 2.24% 5.86% -61.90% 5.47% 41.20% 5.68% 13.59% 11.89% 27.94% 8.77% 108.76% 6.56% Comps ROE 4.61% 8.16% Profit Margin = NI/Sales % Comps Profit Margin 0.51% 13.80% -14.91% 11.76% 7.60% 9.88% 2.99% 15.90% 0.22% 8.44% 5.26% 13.93% 21.25% 10.87% 7.96% 12.56% COGS Margin Comps COGS Margin 73.11% 74.05% 72.53% 60.26% 72.93% 63.52% 75.69% 59.19% 72.81% 60.41% 73.34% 62.03% 58.82% 60.11% SGA Margins SGA/Sales (%) Comps SGA Margin 24.57% 18.86% 12.33% 20.00% 2.66% 19.96% 12.51% 17.55% 23.18% 17.53% 9.43% 17.62% -10.54% 17.84% 7.83% 17.63% Interest Margin Interest/Sales (%) Comps Interest Margin 15.10% 5.78% 13.72% 5.37% 12.34% 5.36% 13.00% 4.66% 13.90% 6.35% 10.36% 5.45% 11.04% 6.01% 11.96% 5.56% Asset Efficiency Ratio Comps AER 0.37 0.16 0.40 0.42 0.25 0.43 0.32 0.43 0.23 0.48 0.26 0.27 0.27 ROA-NI/Assets(bop) % Comps ROA FAE Comps FAE INV-E COGS/INV(bop) Comps INV-E 0.19% 2.20% 0.60 0.27 -5.90% 2.08% 0.73 0.29 3.17% 2.43% 0.73 1.28% 5.01% 0.73 0.52 0.10% 1.98% 0.72 0.39 2.57% 3.74% 0.84 0.44 10.10% 2.83% 0.81 3.79% 3.44% 0.84 16.92 20.15 17.75 21.10 22.42 25.48 24.26 8.47 23.35 7.76 6.68 5.39 7.93 8.80 6.59 7.97 AR-T Comps AFR AP-T-AP(eop)/COGS % Comps AP-T CL Comps CL 15.81% 20.11% 9.18% 20.29% 17.02% 21.94% 15.71% 12.08% 10.00% 15.46% 18.62% 15.75% 15.94% 12.53% 9.37% 14.65% 20.07% 14.51% 15.21% 11.64% 9.27% 12.09% 19.07% 10.95% 16.20% 15.34% 9.37% 23.39% 23.43% 9.68% 15.54% 12.38% 9.56% 16.20% 19.11% 4.81% 14.28% 9.10% 15.90% 23.43% 9.11% 13.91% 9.72% 15.98% 19.07% 8.87% FLR = Assets(eop)/OE(eop) Comps FLR 10.50 13.00 10.66 10.43 0.89 10.76 2.32 8.89 2.42 8.89 2.42 2.63 2.34 2.37 2.33 2.34 DA-Total Debt/Total Assets % Comps DtA DtC Comps Dtc DtEBITDebt(eopEBIT Comps DtEBIT 51.26% 29.36% 52.96% 23.92% 52.54% 24.69% 51.59% 24.02% 52.23% 23.68% 51.60% 24.38% 50.12% 25.75% 50.12% 25.75% 84.33% 43.59% 7.84 14.75 87.31% 35.86% 4.97 4.50 84.85% 36.94% 3.51 4.89 84.32% 35.85% 4.98 2.92 85.05% 35.69% 9.70 84.74% 36.11% 4.25 3.49 81.66% 38.42% 2.45 4.77 38.42% 4.38 4.05 Fixed Coverage Ratio EBIT/Interest Comps FCR EBITDA-S Comps EBITDA-S Interest Rate Comps Interest Rate 2.01 3.93 2.96 3.84 0.93 3.88 82.54% 97.53% 11.60% 6.22% 2.49 4.77 2.35 4.45 2.11 93.59% 57.87% 10.18% 3.05% 118.47% 111.18% 10.58% 3.23% 126.02% 111.35% 9.71% 5.51% 5.66 104.18% 186.85% 10.57% 5.95% 3.59 176.17% 87.86% 10.17% 6.41% 123.07% 102.56% 122.24% 112.47% 6.19% 6.16% Balance Sheet ($MM UON) Assets Cash Accounts Receivable Short-Term Investments Inventory Net PPE Other Assets (non Working-Ca Total Assets DEV TTM 1,358.0 1,448.0 1,478.0 1,664.0 2,058.0 1,766.0 1,743.0 1,743.0 1,856.0 1,942.0 2,130.0 2,119.0 2,326.0 2,610.0 2,649.0 2,649.0 640.0 854.01,204.0 994.0 1,306.0 1,445.0 1,551.0 1,551.0 600.0 16,945.0 18,215.0 19,239.0 19,828.0 20,059.0 20,919.0 23,100.0 23,100.0 0,030.0 9,039.0 8,071.0 8,234.08,224.08,491.0 8,472.0 8,472.0 31,274.0 32,047.0 32,622.0 33,350.0 34,453.0 35,745.0 38,115.0 38,115.0 Q7 Q4 445.0 549.0 500.0 511.0480.0 514.0 600.0 Liabilities Accounts Payable Short-Term Debt Long-Term Debt Other Liabilities (non Working Ca Total Liabilities TTM 88.0 897.0 913.0 978.0 1,073.0 1,169.0 1,135.0 1,135.0 1,402.0 1,694.0 2,130.0 1,662.0 1,365.0 1,500.0 1,197.0 1,197.0 4,630.0 15,277.0 15,009.0 15,542.0 16,629.0 16,945.0 17,905.0 17,905.0 11,475.0 11,713.0 11,509.0 11,969.0 12,222.0 12,810.0 13,589.0 13,589.0 28,295.0 29,581.0 29,561.0 30,151.0 31,289.0 32,424.0 33,826.0 33,826.0 Q7 Q4 Shareholder's E Q7 TTM 2,979.0 2,466.0 3,061.0 3,199.0 3,164.03,321.0 4,289.0 4,289.0 Q4 Equity (Common) Income Statement $MM UON Revenues COGS SGA INT Other Expenses Tax Net Income DEV TTM 2,934.03,091.0 3,340.0 3,484.0 3,590.0 4,200.0 4,250.0 15,524.0 2,145.0 2,242.0 2,436.0 2,637.0 2,864.0 3,058.0 3,117.0 11,676.0 89.0436.0832.0 396.0-448.0 1,216.0 443.0 424.0 412.0 453.0 499.0435.0469.0 1,856.0 441.0330.0 -126.0 302.0 -692.0 -150.0 108.0 -1,252.0 792.0 8.0 221.0 903.01,236.0 Q7 Q6 Q5 Q4 Q3 Q2 Q1 721.0 381.0 51.0 175.0 275.0 156.0 15.0-461.0 254.0 104.0 79.0 240.0 317.0 Cash Flow Statement (SMM UON) Cash Flow (Ops NI Dprec Other Operating Flows CF Ops DEV TTM 8.0 221.0 903.01,236.0 338.9 364.3384.8396.6 401.2 418.4462.0 ,678.1 99.8-168.4 -1,045.0 -880.1 472.0600.0 514.0 734.0509.0 471.0 320.0 2,034.0 Q4 15.0-461.0 254.0 04.0 Q7 Q6 Q5 Q3 Q2 Q1 118.1 696.7-124.8 233.4 Q7 463.0 Q6 0.0 640.0 -612.0 -697.0 -633.0-752.0 -2,694.0 Cash Flow (Inv CAPX Other Investing Flows CF Inv Q5 Q4 Q3 Q2 Q1 TTM 244.0 -333.0 -680.0 -475.0 180.0 -635.0 -1,110.0 -525.0 -2,450.0 130.0 -680. 0 165.0 432.0 62.0 -477.0 227.0 Cash Flow (Fin CF Fin Q1 -622.0 148.0-60.0-362.0 518.0 329.0197.0 Q7 Q6 Q5 Q4 Q2 TTM 682.0 Financial Leverage d) Which company is more levered, based on DtC? e) Does the DTA ratio give the same result as for d) above? Leverage and Financial Sustainability f) Why may it be inaccurate or problematic to measure operating leverage with SDItC? g-i) Based on TTM EBITDA-S, are both companies operating sustainably? g-i) Why or why not? h) Use a financial leverage ratio to explain why DEV's interest rate is generally higher than CEN's Practice Problems for Chapter 4 Ratio Analysis Devon Energy Inc. (DEV) is a power generator and distributor, which participates heavily in regulated and unregulated (spot) energy markets. Complete Energy Network (CEN) is a similarly sized utility, operating primarily in similar markets. Neither company is seasonal. Listed below are DEV's financial statements and stock market data, and ratio analyses for both 1. Fill in the missing ratios for DEV. Devon Energy Inc. DEV Sales (SMM) Comps Sales Sales Growth Comps Sales Growth Ratio Analysis 2,9343,091 3,340 3,484 3,590 4,200 4,25015,524 Q7 Q4 Q2 2,805 3,0352,966 3,818 2,8803,3373,229 13,264 1.17% -17.50% 5.35% 8.20% 8.06% -2.27% 4.31% 28.73% 3.04% -24.57% 1.19% -3.24% 26.57% 15.87% 8.67% ROE 2.24% 5.86% -61.90% 5.47% 41.20% 5.68% 13.59% 11.89% 27.94% 8.77% 108.76% 6.56% Comps ROE 4.61% 8.16% Profit Margin = NI/Sales % Comps Profit Margin 0.51% 13.80% -14.91% 11.76% 7.60% 9.88% 2.99% 15.90% 0.22% 8.44% 5.26% 13.93% 21.25% 10.87% 7.96% 12.56% COGS Margin Comps COGS Margin 73.11% 74.05% 72.53% 60.26% 72.93% 63.52% 75.69% 59.19% 72.81% 60.41% 73.34% 62.03% 58.82% 60.11% SGA Margins SGA/Sales (%) Comps SGA Margin 24.57% 18.86% 12.33% 20.00% 2.66% 19.96% 12.51% 17.55% 23.18% 17.53% 9.43% 17.62% -10.54% 17.84% 7.83% 17.63% Interest Margin Interest/Sales (%) Comps Interest Margin 15.10% 5.78% 13.72% 5.37% 12.34% 5.36% 13.00% 4.66% 13.90% 6.35% 10.36% 5.45% 11.04% 6.01% 11.96% 5.56% Asset Efficiency Ratio Comps AER 0.37 0.16 0.40 0.42 0.25 0.43 0.32 0.43 0.23 0.48 0.26 0.27 0.27 ROA-NI/Assets(bop) % Comps ROA FAE Comps FAE INV-E COGS/INV(bop) Comps INV-E 0.19% 2.20% 0.60 0.27 -5.90% 2.08% 0.73 0.29 3.17% 2.43% 0.73 1.28% 5.01% 0.73 0.52 0.10% 1.98% 0.72 0.39 2.57% 3.74% 0.84 0.44 10.10% 2.83% 0.81 3.79% 3.44% 0.84 16.92 20.15 17.75 21.10 22.42 25.48 24.26 8.47 23.35 7.76 6.68 5.39 7.93 8.80 6.59 7.97 AR-T Comps AFR AP-T-AP(eop)/COGS % Comps AP-T CL Comps CL 15.81% 20.11% 9.18% 20.29% 17.02% 21.94% 15.71% 12.08% 10.00% 15.46% 18.62% 15.75% 15.94% 12.53% 9.37% 14.65% 20.07% 14.51% 15.21% 11.64% 9.27% 12.09% 19.07% 10.95% 16.20% 15.34% 9.37% 23.39% 23.43% 9.68% 15.54% 12.38% 9.56% 16.20% 19.11% 4.81% 14.28% 9.10% 15.90% 23.43% 9.11% 13.91% 9.72% 15.98% 19.07% 8.87% FLR = Assets(eop)/OE(eop) Comps FLR 10.50 13.00 10.66 10.43 0.89 10.76 2.32 8.89 2.42 8.89 2.42 2.63 2.34 2.37 2.33 2.34 DA-Total Debt/Total Assets % Comps DtA DtC Comps Dtc DtEBITDebt(eopEBIT Comps DtEBIT 51.26% 29.36% 52.96% 23.92% 52.54% 24.69% 51.59% 24.02% 52.23% 23.68% 51.60% 24.38% 50.12% 25.75% 50.12% 25.75% 84.33% 43.59% 7.84 14.75 87.31% 35.86% 4.97 4.50 84.85% 36.94% 3.51 4.89 84.32% 35.85% 4.98 2.92 85.05% 35.69% 9.70 84.74% 36.11% 4.25 3.49 81.66% 38.42% 2.45 4.77 38.42% 4.38 4.05 Fixed Coverage Ratio EBIT/Interest Comps FCR EBITDA-S Comps EBITDA-S Interest Rate Comps Interest Rate 2.01 3.93 2.96 3.84 0.93 3.88 82.54% 97.53% 11.60% 6.22% 2.49 4.77 2.35 4.45 2.11 93.59% 57.87% 10.18% 3.05% 118.47% 111.18% 10.58% 3.23% 126.02% 111.35% 9.71% 5.51% 5.66 104.18% 186.85% 10.57% 5.95% 3.59 176.17% 87.86% 10.17% 6.41% 123.07% 102.56% 122.24% 112.47% 6.19% 6.16% Balance Sheet ($MM UON) Assets Cash Accounts Receivable Short-Term Investments Inventory Net PPE Other Assets (non Working-Ca Total Assets DEV TTM 1,358.0 1,448.0 1,478.0 1,664.0 2,058.0 1,766.0 1,743.0 1,743.0 1,856.0 1,942.0 2,130.0 2,119.0 2,326.0 2,610.0 2,649.0 2,649.0 640.0 854.01,204.0 994.0 1,306.0 1,445.0 1,551.0 1,551.0 600.0 16,945.0 18,215.0 19,239.0 19,828.0 20,059.0 20,919.0 23,100.0 23,100.0 0,030.0 9,039.0 8,071.0 8,234.08,224.08,491.0 8,472.0 8,472.0 31,274.0 32,047.0 32,622.0 33,350.0 34,453.0 35,745.0 38,115.0 38,115.0 Q7 Q4 445.0 549.0 500.0 511.0480.0 514.0 600.0 Liabilities Accounts Payable Short-Term Debt Long-Term Debt Other Liabilities (non Working Ca Total Liabilities TTM 88.0 897.0 913.0 978.0 1,073.0 1,169.0 1,135.0 1,135.0 1,402.0 1,694.0 2,130.0 1,662.0 1,365.0 1,500.0 1,197.0 1,197.0 4,630.0 15,277.0 15,009.0 15,542.0 16,629.0 16,945.0 17,905.0 17,905.0 11,475.0 11,713.0 11,509.0 11,969.0 12,222.0 12,810.0 13,589.0 13,589.0 28,295.0 29,581.0 29,561.0 30,151.0 31,289.0 32,424.0 33,826.0 33,826.0 Q7 Q4 Shareholder's E Q7 TTM 2,979.0 2,466.0 3,061.0 3,199.0 3,164.03,321.0 4,289.0 4,289.0 Q4 Equity (Common) Income Statement $MM UON Revenues COGS SGA INT Other Expenses Tax Net Income DEV TTM 2,934.03,091.0 3,340.0 3,484.0 3,590.0 4,200.0 4,250.0 15,524.0 2,145.0 2,242.0 2,436.0 2,637.0 2,864.0 3,058.0 3,117.0 11,676.0 89.0436.0832.0 396.0-448.0 1,216.0 443.0 424.0 412.0 453.0 499.0435.0469.0 1,856.0 441.0330.0 -126.0 302.0 -692.0 -150.0 108.0 -1,252.0 792.0 8.0 221.0 903.01,236.0 Q7 Q6 Q5 Q4 Q3 Q2 Q1 721.0 381.0 51.0 175.0 275.0 156.0 15.0-461.0 254.0 104.0 79.0 240.0 317.0 Cash Flow Statement (SMM UON) Cash Flow (Ops NI Dprec Other Operating Flows CF Ops DEV TTM 8.0 221.0 903.01,236.0 338.9 364.3384.8396.6 401.2 418.4462.0 ,678.1 99.8-168.4 -1,045.0 -880.1 472.0600.0 514.0 734.0509.0 471.0 320.0 2,034.0 Q4 15.0-461.0 254.0 04.0 Q7 Q6 Q5 Q3 Q2 Q1 118.1 696.7-124.8 233.4 Q7 463.0 Q6 0.0 640.0 -612.0 -697.0 -633.0-752.0 -2,694.0 Cash Flow (Inv CAPX Other Investing Flows CF Inv Q5 Q4 Q3 Q2 Q1 TTM 244.0 -333.0 -680.0 -475.0 180.0 -635.0 -1,110.0 -525.0 -2,450.0 130.0 -680. 0 165.0 432.0 62.0 -477.0 227.0 Cash Flow (Fin CF Fin Q1 -622.0 148.0-60.0-362.0 518.0 329.0197.0 Q7 Q6 Q5 Q4 Q2 TTM 682.0 Financial Leverage d) Which company is more levered, based on DtC? e) Does the DTA ratio give the same result as for d) above? Leverage and Financial Sustainability f) Why may it be inaccurate or problematic to measure operating leverage with SDItC? g-i) Based on TTM EBITDA-S, are both companies operating sustainably? g-i) Why or why not? h) Use a financial leverage ratio to explain why DEV's interest rate is generally higher than CEN's