Answered step by step
Verified Expert Solution
Link Copied!

Question

1 Approved Answer

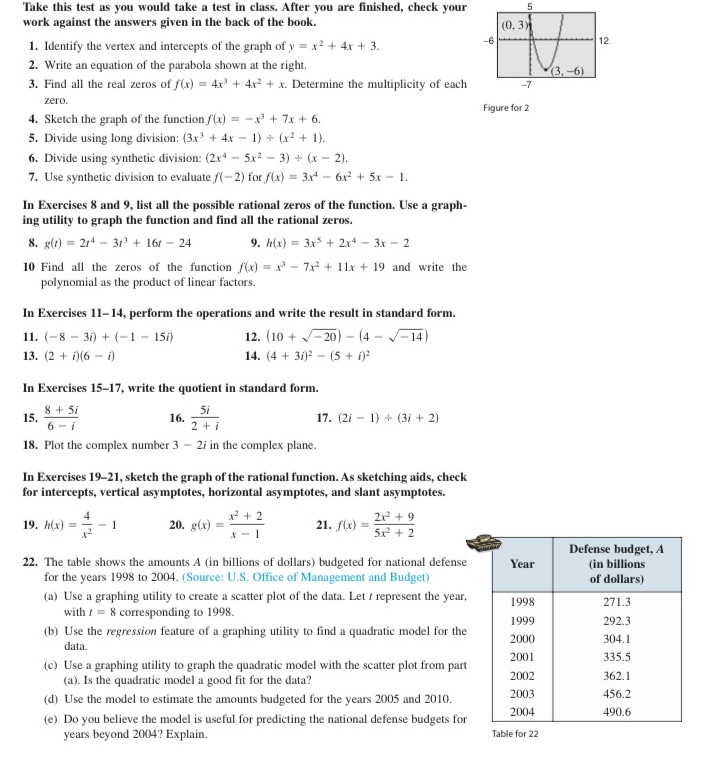
Precal c2 polynomial and rational functions; please show work so I know the process. Take this test as you would take a test in class.

Precal c2 polynomial and rational functions; please show work so I know the process.

image text in transcribed
Take this test as you would take a test in class. After you are finished, check your work against the answers given in the back of the book. 10. 3 1. Identify the vertex and intercepts of the graph of y = x2 + 4x + 3. 12 2. Write an equation of the parabola shown at the right. (3. -6) 3. Find all the real zeros of f(x) = 4x3 + 4x2 + x. Determine the multiplicity of each zero. Figure for 2 4. Sketch the graph of the function /(x) = -x' + 7x + 6. 5. Divide using long division: (3x] + 4x - 1) + (x3 + 1). 6. Divide using synthetic division: (2x4 - 5x2 - 3) + (x - 2). 7. Use synthetic division to evaluate f(-2) for f(x) = 3x4 - 6x3 + 5x - 1. In Exercises & and 9, list all the possible rational zeros of the function. Use a graph- ing utility to graph the function and find all the rational zeros. 8. g(1) = 214 - 3r3 + 161 - 24 9. h(x) = 3x5 + 2x4 - 3.x - 2 10 Find all the zeros of the function /(x) = x - 7x2 + 11x + 19 and write the polynomial as the product of linear factors. In Exercises 11-14, perform the operations and write the result in standard form. 11. (-8 - 37) + (-1 - 15/) 12. (10 + /-20) - (4 - -14) 13. (2 + 0)(6 - 1) 14. (4 + 3/)2 - (5 + 1)2 In Exercises 15-17, write the quotient in standard form. 15, 8 + 5i Si 6- i 16. 7 2+ i 17. (27 - 1) + (37 + 2) 18. Plot the complex number 3 - 2/ in the complex plane. In Exercises 19-21, sketch the graph of the rational function. As sketching aids, check for intercepts, vertical asymptotes, horizontal asymptotes, and slant asymptotes. 19. h(x) = 20. g(x) = 17 + 2 21. /()= 21 +9 5x3 + 2 Defense budget, A 22. The table shows the amounts A (in billions of dollars) budgeted for national defense Year (in billions for the years 1998 to 2004. (Source: U.S. Office of Management and Budget) of dollars) (a) Use a graphing utility to create a scatter plot of the data. Let / represent the year. 1998 271.3 with r = 8 corresponding to 1998. 1999 292.3 (b) Use the regression feature of a graphing utility to find a quadratic model for the 2000 304.1 data. 2001 335.5 (c) Use a graphing utility to graph the quadratic model with the scatter plot from part (a). Is the quadratic model a good fit for the data? 2002 362.1 (d) Use the model to estimate the amounts budgeted for the years 2005 and 2010. 2003 456.2 2004 490.6 (e) Do you believe the model is useful for predicting the national defense budgets for years beyond 2004? Explain. Table for 22

Step by Step Solution

There are 3 Steps involved in it

Step: 1

blur-text-image

Get Instant Access to Expert-Tailored Solutions

See step-by-step solutions with expert insights and AI powered tools for academic success

Step: 2

blur-text-image

Step: 3

blur-text-image

Ace Your Homework with AI

Get the answers you need in no time with our AI-driven, step-by-step assistance

Get Started

Recommended Textbook for

From Calculus To Analysis

Authors: Steen Pedersen

1st Edition

3319136410, 9783319136417

More Books

Students also viewed these Mathematics questions

Question

=+b) What might you consider doing next?

Answered: 1 week ago