Answered step by step
Verified Expert Solution
Question
1 Approved Answer
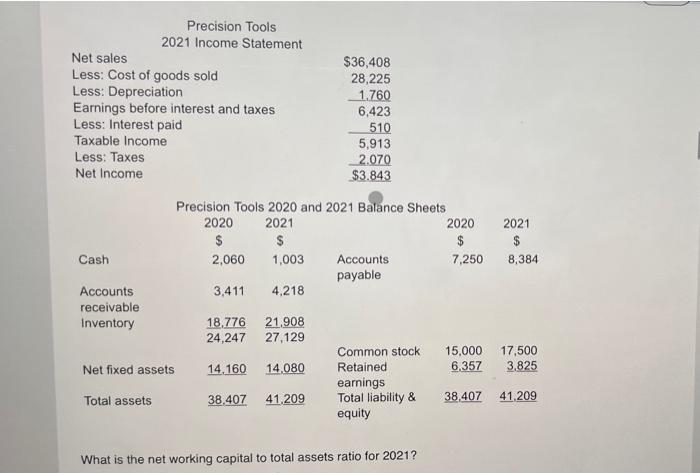
Precision Tools 2021 Income Statement Net sales $36,408 28,225 Less: Cost of goods sold Less: Depreciation Earnings before interest and taxes Less: Interest paid


Precision Tools 2021 Income Statement Net sales $36,408 28,225 Less: Cost of goods sold Less: Depreciation Earnings before interest and taxes Less: Interest paid Taxable Income 1.760 6,423 510 5,913 2.070 $3.843 Less: Taxes Net Income Precision Tools 2020 and 2021 Balance Sheets 2020 2021 2020 2021 $ $ 7,250 Cash 2,060 1,003 Accounts 8,384 payable 3,411 Accounts receivable 4,218 Inventory 18,776 24,247 21,908 27,129 Common stock 15,000 17,500 Net fixed assets 14,160 14.080 Retained 6,357 3,825 earnings Total liability & equity 38.407 41.209 38.407 41,209 Total assets What is the net working capital to total assets ratio for 2021? New par value $0.15 per share; Last year's dividend per share $1.73 New par value $0.35 per share; Last year's dividend per share $3.73 New par value $0.25 per share; Last year's dividend per share $2.73 New par value $0.20 per share; Last year's dividend per share $5.73
Step by Step Solution
★★★★★
3.45 Rating (164 Votes )
There are 3 Steps involved in it
Step: 1
Computation of Time interest earned r...
Get Instant Access to Expert-Tailored Solutions
See step-by-step solutions with expert insights and AI powered tools for academic success
Step: 2

Step: 3

Ace Your Homework with AI
Get the answers you need in no time with our AI-driven, step-by-step assistance
Get Started


