Answered step by step
Verified Expert Solution
Question
1 Approved Answer
Precision Transfer, Inc. makes more than 300 types of precision gears. The operations to make the different types are similar, but the time and
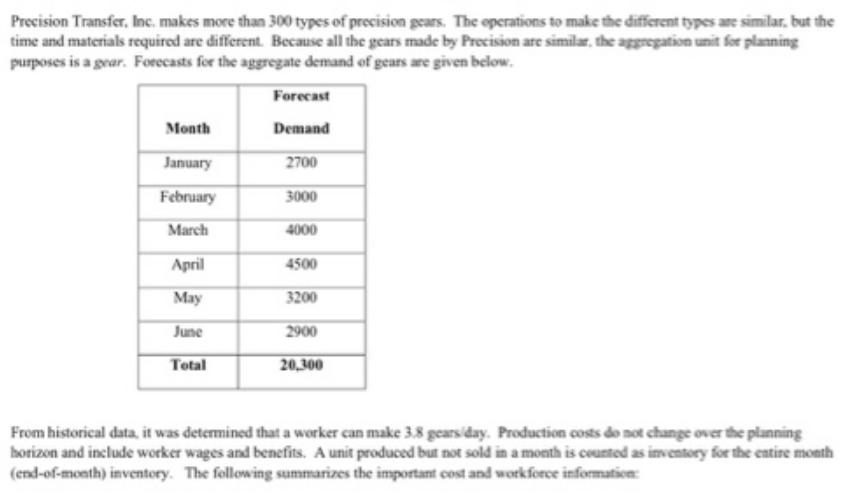
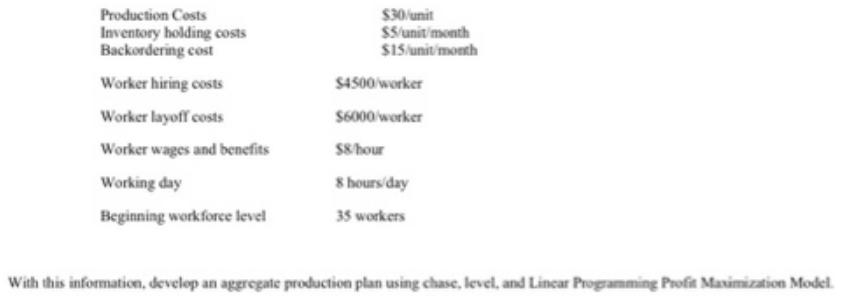
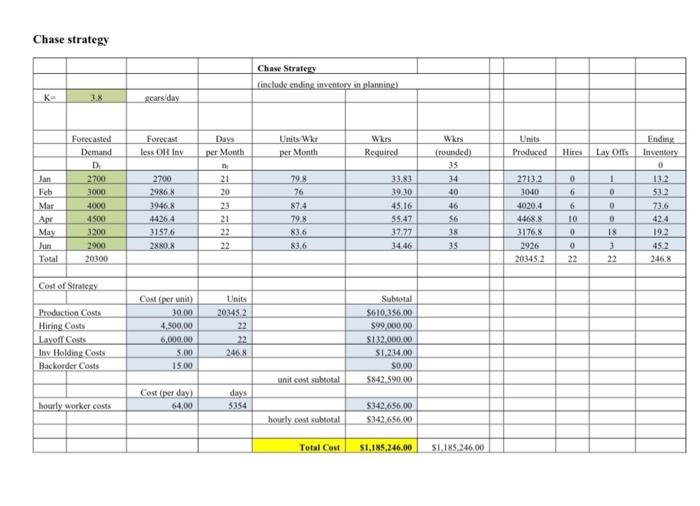
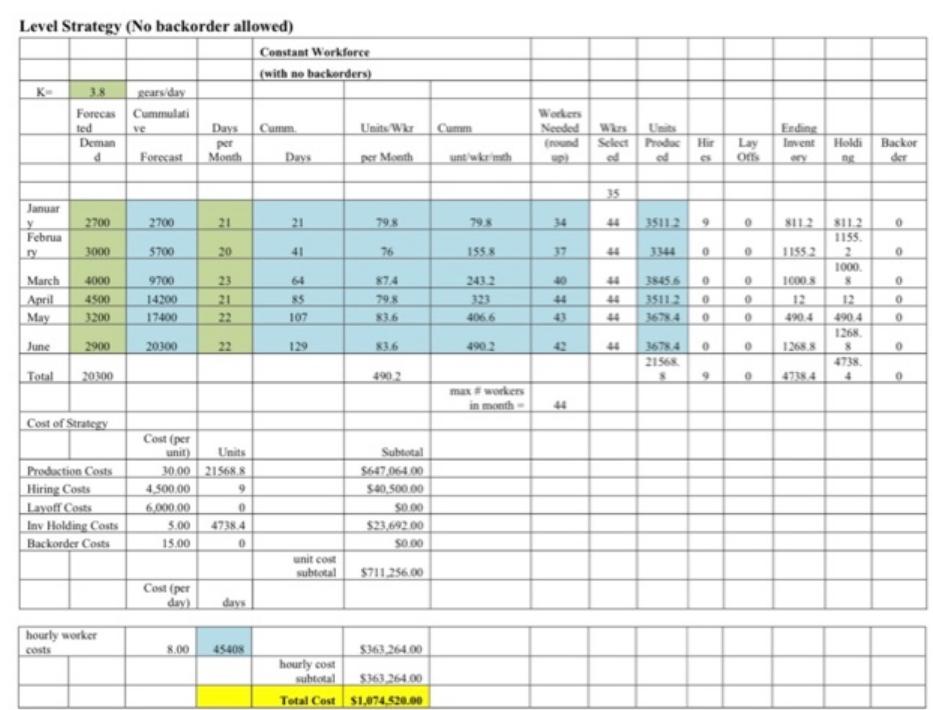
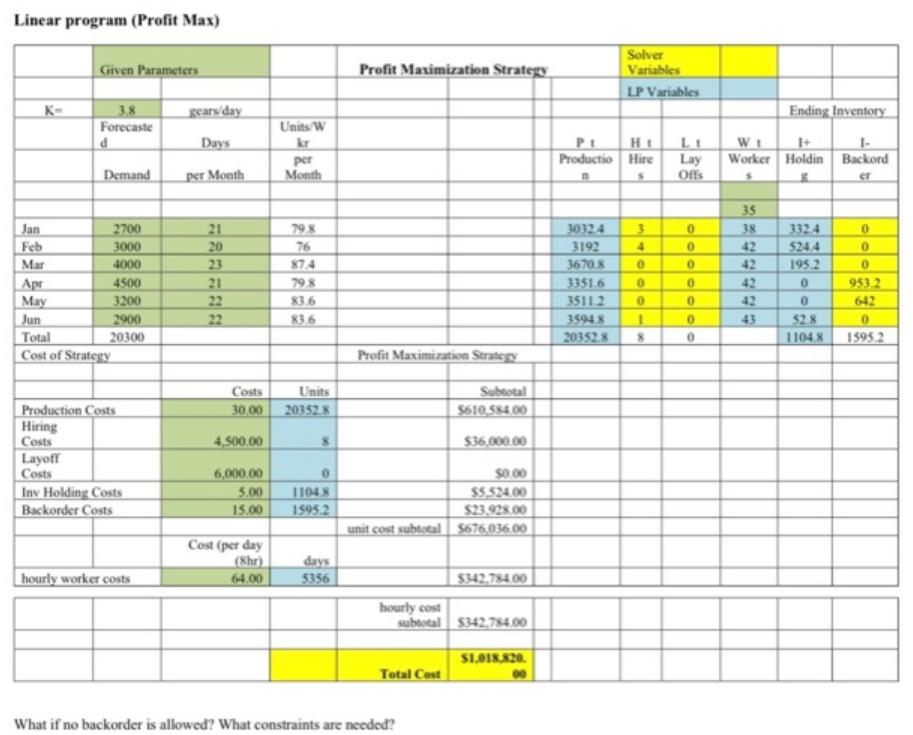
Precision Transfer, Inc. makes more than 300 types of precision gears. The operations to make the different types are similar, but the time and materials required are different. Because all the gears made by Precision are similar, the aggregation unit for planning purposes is a gear. Forecasts for the aggregate demand of gears are given below. Month January February March April May June Total Forecast Demand 2700 3000 4000 4500 3200 2900 20,300 From historical data, it was determined that a worker can make 3.8 gears/day. Production costs do not change over the planning horizon and include worker wages and benefits. A unit produced but not sold in a month is counted as inventory for the entire month (end-of-month) inventory. The following summarizes the important cost and workforce information: Production Costs Inventory holding costs Backordering cost Worker hiring costs Worker layoff costs Worker wages and benefits Working day Beginning workforce level $30/unit $5/unit/month $15/unit/month $4500 worker $6000 worker $8/hour 8 hours/day 35 workers With this information, develop an aggregate production plan using chase, level, and Linear Programming Profit Maximization Model. Chase strategy K= Jan Feb Mar Apr May Jun Total 3.8 Forecasted Demand D 2700 3000 4000 4500 3200 2900 20300 Cost of Strategy Production Costs Hiring Costs Layoff Costs Inv Holding Costs Backorder Costs hourly worker costs gears/day Forecast less OH Inv 2700 29868 3946.8 4426 4 31576 2880.8 Cost (per unit) 30.00 4.500.00 6,000.00 5.00 15.00 Cost (per day) 64.00 Days per Month CARRERA 22 Units 20345,2 22 22 246.8 days 5354 Chase Strategy (include ending inventory in planning) Units Wkr per Month 79.8 76 87.4 79.8 83.6 83.6 unit cost subtotal hourly cost subtotal Total Cost Wkrs Required 33.83 39.30 45.16 55.47 37.77 34.46 Subtotal $610,356.00 $99,000.00 $132.000.00 $1.234.00 $0.00 $842.590.00 $342,656.00 $342.656.00 $1,185,246.00 Wkrs (rounded) 35 34 40 46 56 38 35 $1,185,246.00 Units Produced Hires 2713,2 3040 4020.4 4468.8 3176.8 2926 20345.2 0 6 6 10 0 0 22 Lay Offs 1 0 0 0 18 3 22 Ending Inventory 0 132 53.2 73.6 42.4 19.2 45.2 246.8 Level Strategy (No backorder allowed) K- Januar Februa ry March April May June 3.8 gears/day Cummulati Forecas ted Deman 2700 3000 4000 4500 3200 2900 Total 20300 Cost of Strategy Production Costs Hiring Costs Layoff Costs Inv Holding Costs Backorder Costs hourly worker costs Forecast 2700 $700 9700 14200 17400 20300 4.500.00 6,000.00 5.00 15.00 Cost (per day) Days per Month 8.00 21 Cost (per unit) Units 30.00 21568.8 20 23 21 22 9 0 4738.4 0 days 45408 Constant Workforce (with no backorders) Cumm Days 21 = 325 2 107 129 unit cost subtotal hourly cost subtotal Total Cost Units Wkr per Month 79.8 874 79.8 83.6 83.6 490.2 Subtotal $647,064.00 $40.500.00 $0.00 $23,692.00 $0.00 $711.256.00 $363,264.00 $363,264.00 $1,074,520.00 unt wkr mth 79.8 155.8 243.2 406.6 490.2 max #workers in month- Workers Needed 34 37 44 44 Wars Units Select Produc Hir ed ed 35 44 35112 44 6 3845.6 44 35112 0 44 21568 0 0 ooo 0 0 9 Lay Offs 0 0 000 0 0 Erding Invent 811.2 1155 2 1000 8 12 490.4 47384 Holdi Backor ng der 811.2 1155. 2 1000. 8 12 490.4 1268. 8 4738 4 0 0 0 0 0 0 0 Linear program (Profit Max) K- Given Parameters 3.8 Forecaste d Demand Jan Feb Mar Apr May Jun Total Cost of Strategy Layoff Costs 2700 3000 4000 4500 3200 2900 20300 Production Costs Hiring Costs Inv Holding Costs Backorder Costs hourly worker costs gears day Days per Month 21 20 23 21 22 22 4.500.00 6,000,00 5.00 15.00 Units W kr Costs Units 30,00 20352.8 Cost (per day (Shr) 64.00 per Month 79.8 76 87.4 79.8 83.6 83.6 0 1104.8 1595.2 days 5356 Profit Maximization Strategy Profit Maximization Strategy hourly cost $0.00 $5.524.00 $23.928.00 unit cost subtotal $676.036.00 Subtotal $610,584.00 Total Cost What if no backorder is allowed? What constraints are needed? $36,000.00 $342,784.00 subtotal $342,784.00 $1,018,820. 00 3032.4 3192 3670.8 Solver Variables LP Variables P..t Productio Hire 3351.6 3511.2 3594.8 20352.8 Ht Lt Lay Offs 4 0 00 1 8 0 0 0 0 0 0 WI 1+ Worker Holdin 35 38 42 42 42 Ending Inventory 1- Backord er 43 332.4 524.4 195.2 0 0 52.8 1104.8 0 0 953.2 642 0 1595.2
Step by Step Solution
★★★★★
3.58 Rating (159 Votes )
There are 3 Steps involved in it
Step: 1
Last year precision made 41600 gears in Days 260 Number of workers 40 Therefore Labor Standard 41600 ...
Get Instant Access to Expert-Tailored Solutions
See step-by-step solutions with expert insights and AI powered tools for academic success
Step: 2

Step: 3

Ace Your Homework with AI
Get the answers you need in no time with our AI-driven, step-by-step assistance
Get Started


