Answered step by step
Verified Expert Solution
Question
1 Approved Answer
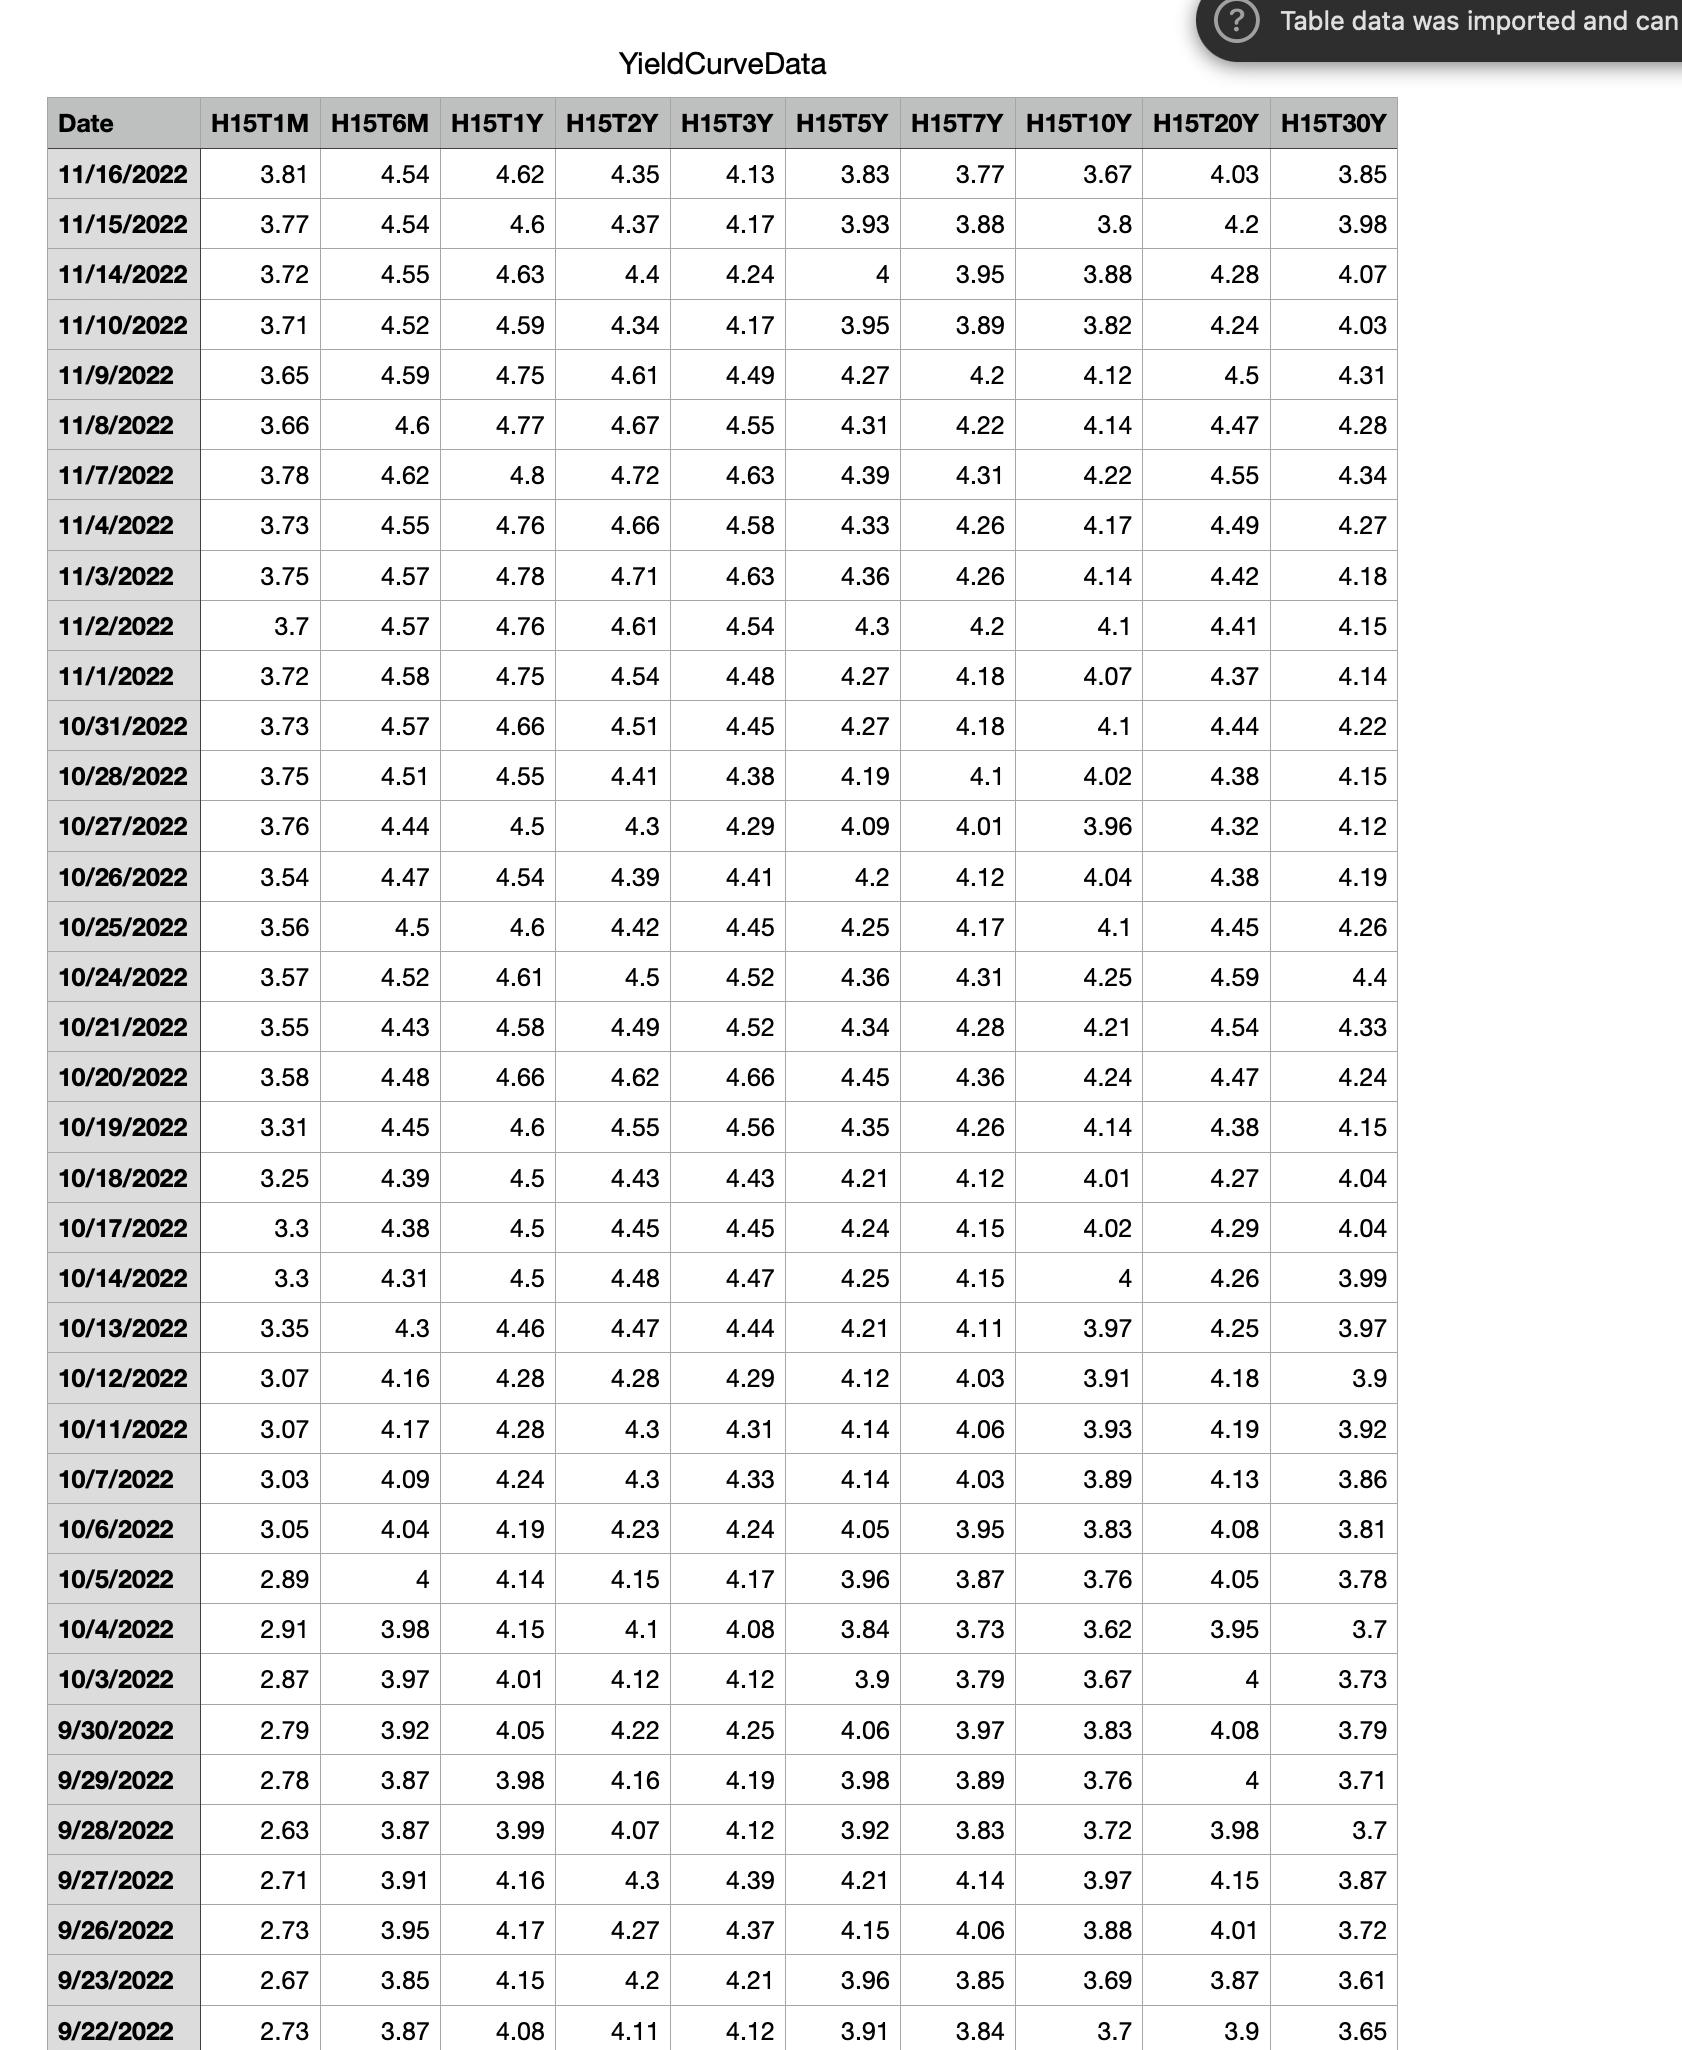
Preform a PCA on the yield curve data, interpret the eigenvectors and values Date 11/16/2022 11/15/2022 11/14/2022 11/10/2022 11/9/2022 11/8/2022 11/7/2022 11/4/2022 11/3/2022 11/2/2022


Preform a PCA on the yield curve data, interpret the eigenvectors and values Date 11/16/2022 11/15/2022 11/14/2022 11/10/2022 11/9/2022 11/8/2022 11/7/2022 11/4/2022 11/3/2022 11/2/2022 11/1/2022 10/31/2022 10/28/2022 10/27/2022 10/26/2022 10/25/2022 10/24/2022 10/21/2022 10/20/2022 10/19/2022 10/18/2022 10/17/2022 10/14/2022 10/13/2022 10/12/2022 10/11/2022 10/7/2022 10/6/2022 10/5/2022 10/4/2022 10/3/2022 9/30/2022 9/29/2022 9/28/2022 9/27/2022 9/26/2022 9/23/2022 9/22/2022 3.81 3.77 3.72 3.71 3.65 3.66 3.78 3.73 3.75 3.7 3.72 3.73 3.75 3.76 3.54 3.56 3.57 3.55 3.58 3.31 3.25 3.3 3.3 3.35 3.07 3.07 3.03 3.05 2.89 2.91 2.87 2.79 2.78 2.63 2.71 2.73 2.67 2.73 H15T1M H15T6M H15T1Y H15T2Y H15T3Y H15T5Y H15T7Y H15T10Y H15T20Y H15T30Y 4.13 4.17 4.24 4.17 4.49 4.55 4.63 4.58 4.63 4.54 4.48 4.45 4.38 4.29 4.41 4.45 4.52 4.52 4.66 4.56 4.43 4.45 4.47 4.44 4.29 4.31 4.33 4.24 4.17 4.08 4.12 4.25 4.19 4.12 4.39 4.37 4.21 4.12 4.54 4.54 4.55 4.52 4.59 4.6 4.62 4.55 4.57 4.57 4.58 4.57 4.51 4.44 4.47 4.5 4.52 4.43 4.48 4.45 4.39 4.38 4.31 4.3 4.16 4.17 4.09 4.04 4 3.98 3.97 3.92 3.87 3.87 3.91 3.95 3.85 3.87 4.62 4.6 4.63 4.59 4.75 4.77 4.8 4.76 4.78 4.76 4.75 4.66 4.55 4.5 Yield Curve Data 4.54 4.6 4.61 4.58 4.66 4.6 4.5 4.5 4.5 4.46 4.28 4.28 4.24 4.19 4.14 4.15 4.01 4.05 3.98 3.99 4.16 4.17 4.15 4.08 4.35 4.37 4.4 4.34 4.61 4.67 4.72 4.66 4.71 4.61 4.54 4.51 4.41 4.3 4.39 4.42 4.5 4.49 4.62 4.55 4.43 4.45 4.48 4.47 4.28 4.3 4.3 4.23 4.15 4.1 4.12 4.22 4.16 4.07 4.3 4.27 4.2 4.11 3.83 3.93 4 3.95 4.27 4.31 4.39 4.33 4.36 4.3 4.27 4.27 4.19 4.09 4.2 4.25 4.36 4.34 4.45 4.35 4.21 4.24 4.25 4.21 4.12 4.14 4.14 4.05 3.96 3.84 3.9 4.06 3.98 3.92 4.21 4.15 3.96 3.91 3.77 3.88 3.95 3.89 4.2 4.22 4.31 4.26 4.26 4.2 4.18 4.18 4.1 4.01 4.12 4.17 4.31 4.28 4.36 4.26 4.12 4.15 4.15 4.11 4.03 4.06 4.03 3.95 3.87 3.73 3.79 3.97 3.89 3.83 4.14 4.06 3.85 3.84 3.67 3.8 3.88 3.82 4.12 4.14 4.22 4.17 4.14 4.1 4.07 4.1 4.02 3.96 4.04 4.1 4.25 4.21 4.24 4.14 4.01 4.02 4 3.97 3.91 3.93 3.89 3.83 3.76 3.62 3.67 3.83 3.76 3.72 3.97 3.88 3.69 3.7 4.03 4.2 4.28 4.24 4.5 4.47 4.55 4.49 4.42 4.41 4.37 4.44 4.38 4.32 4.38 4.45 4.59 4.54 4.47 4.38 4.27 4.29 4.26 4.25 4.18 4.19 4.13 4.08 4.05 3.95 4 4.08 4 Table data was imported and can 3.98 4.15 4.01 3.87 3.9 3.85 3.98 4.07 4.03 4.31 4.28 4.34 4.27 4.18 4.15 4.14 4.22 4.15 4.12 4.19 4.26 4.4 4.33 4.24 4.15 4.04 4.04 3.99 3.97 3.9 3.92 3.86 3.81 3.78 3.7 3.73 3.79 3.71 3.7 3.87 3.72 3.61 3.65
Step by Step Solution
★★★★★
3.31 Rating (157 Votes )
There are 3 Steps involved in it
Step: 1
Performing a Principal Component Analysis PCA on the yield curve data involves several steps including data preparation covariance matrix calculation ...
Get Instant Access to Expert-Tailored Solutions
See step-by-step solutions with expert insights and AI powered tools for academic success
Step: 2

Step: 3

Ace Your Homework with AI
Get the answers you need in no time with our AI-driven, step-by-step assistance
Get Started


