

Preliminary Analysis Generate daily continuously compounded returns for 10 assets. Compute essential statistical measures. Analyze correlation. Generate
No answer yet for this question.
Ask a Tutor
Question:
Preliminary Analysis Generate daily continuously compounded returns for 10 assets. Compute essential statistical measures. Analyze correlation. Generate the equally weighted portfolio consisting of these ten assets. Evaluate portfolio performance measures including the traditional measures for the equally weighted portfolio (e.g., Sharpe and Treynor ratios).
- Part II Generate efficient frontiers using the Markowitz optimization method under two scenarios regarding short-sale assumptions:
- Scenario 1: Short Sales Not Permitted Utilize continuously compounded return data from 21 March 2019 to 21 March 2024. Construct efficient frontiers for target returns ranging from 2% to 25%, with 1% increments. Report instances of infeasibility where convergence is not achieved. Tabulate annualized target expected returns and standard deviations for feasible portfolios along with traditional portfolio evaluation measures such as Sharpe and Treynor ratios (Table 1). Generate an efficient frontier graph (Graph 1) with Expected Returns on the y-axis and standard deviations on the x-axis, using optimized portfolios from Table 1.
- Scenario 2: Short Sales Permitted Repeat the above process with short-sales allowed by deleting the constraint that forced all weights to be positive in Scebario 1. Tabulate annualized target returns and standard deviations for feasible portfolios along with traditional portfolio evaluation measures such as Sharpe and Treynor ratios (Table 2). Generate an efficient frontier graph (Graph 2) with Expected Returns on the y-axis and standard deviations on the x-axis, using optimized portfolios from Table 2.
Transcribed Image Text:
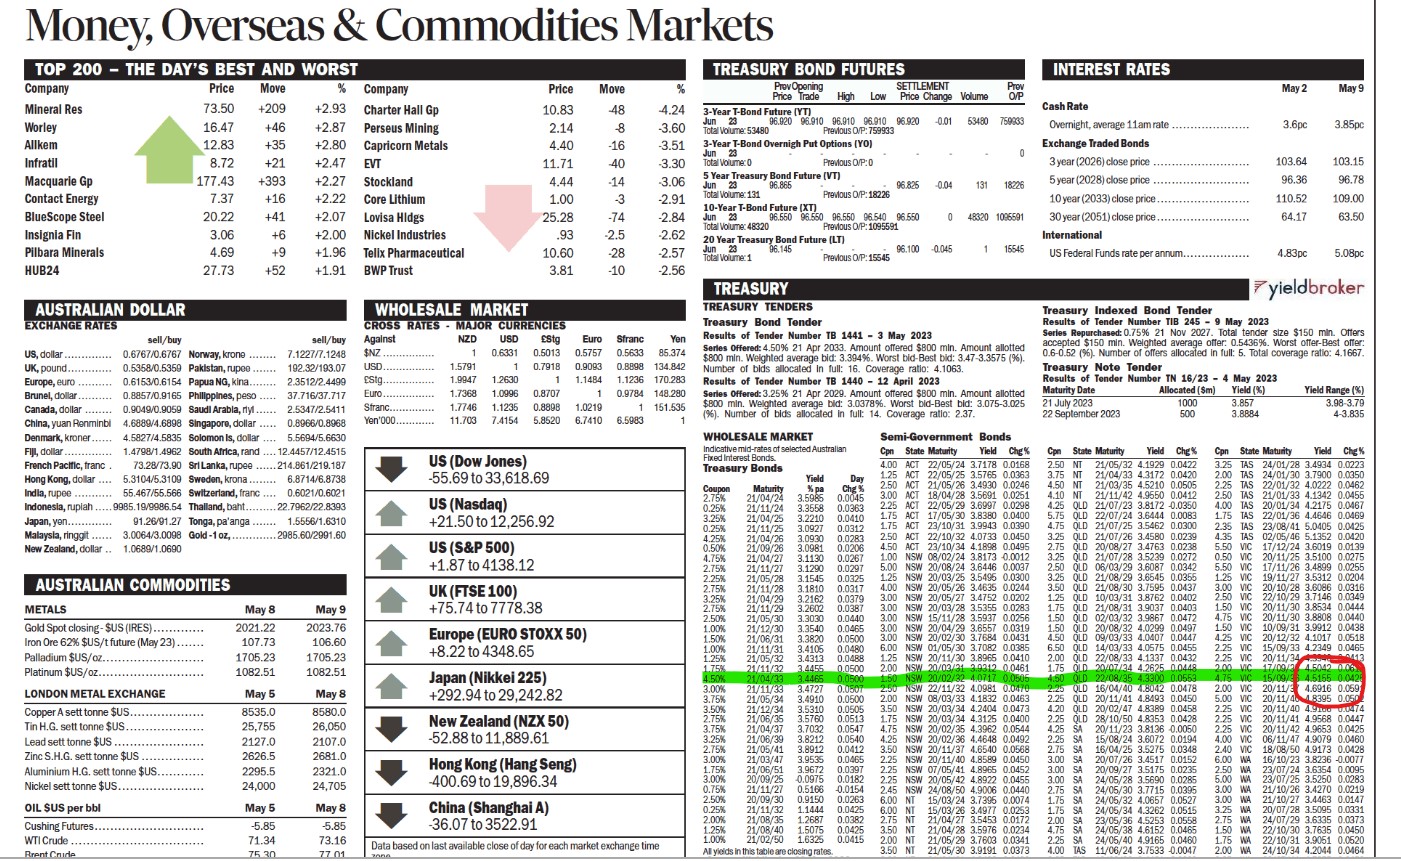
Money, Overseas & Commodities Markets TREASURY BOND FUTURES TOP 200 - THE DAY'S BEST AND WORST INTEREST RATES Company Price Move % Company Price Move Prov Opening Price Trade Mineral Res 73.50 +209 +2.93 Charter Hall Gp 10.83 -48 -4.24 3-Year T-Bond Future (YT) Jun 23 Worley 16.47 +46 +2.87 Perseus Mining 2.14 -8 -3.60 Total Volume: 53480 96.920 96.910 96.910 96.910 96.920 -0.01 Previous O/P: 759933 SETTLEMENT High Low Price Change Volume 53480 759933 Prov May 2 May 9 O/P Cash Rate Overnight, average 11am rate. 3.6pc 3.85pc Allkem 12.83 +35 +2.80 Capricorn Metals 4.40 -16 -3.51 3-Year T-Bond Overnigh Put Options (YO) Exchange Traded Bonds Jun 23 0 Infratil 8.72 +21 +2.47 EVT 11.71 -40 -3.30 Total Volume: 0 Previous O/P:0 3 year (2026) close price. Macquarie Gp 177.43 +393 +2.27 Stockland 4.44 -14 -3.06 5 Year Treasury Bond Future (VT) Jun 23 96.865 96.825 -0.04 131 18226 5 year (2028) close price. Contact Energy 7.37 +16 +2.22 Core Lithium 1.00 -3 -2.91 Total Volume: 131 Previous O/P: 18226 10 year (2033) close price. 10-Year T-Bond Future (XT) BlueScope Steel 20.22 +41 +2.07 Lovisa Hldgs 25.28 -74 -2.84 Jun 23 Total Volume: 48320 96.550 96.550 96.550 96.540 96.550 Previous OVP: 1095591 0 48320 1096591 Insignia Fin 3.06 +6 +2.00 Nickel Industries .93 -2.5 -2.62 30 year (2051) close price.. International 103.64 103.15 96.36 96.78 110.52 109.00 64.17 63.50 20 Year Treasury Bond Future (LT) Pilbara Minerals 4.69 +9 +1.96 Telix Pharmaceutical 10.60 Jun 23 -28 -2.57 96.145 - 96.100 -0.045 1 15545 Total Volume: 1 Previous O/P: 15545 US Federal Funds rate per annum.... 4.83pc 5.08pc HUB24 27.73 +52 +1.91 BWP Trust 3.81 -10 -2.56 TREASURY TREASURY TENDERS Treasury Bond Tender Results of Tender Number TB 1441 - 3 May 2023 Series Offered: 4.50% 21 Apr 2033. Amount offered $800 min. Amount allotted $800 min. Weighted average bid: 3.394%. Worst bid-Best bid: 3.47-3.3575 (%). Number of bids allocated in full: 16. Coverage ratio: 4.1063. Results of Tender Number TB 1440 - 12 April 2023 Series Offered: 3.25% 21 Apr 2029. Amount offered $800 min. Amount allotted $800 min. Weighted average bid: 3.0378%. Worst bid-Best bid: 3.075-3.025 (%). Number of bids allocated in full: 14. Coverage ratio: 2.37. Indicative mid-rates of selected Australian All yields in this table are closing rates. Semi-Government Bonds Cpn State Maturity Yield Che% 4.00 ACT 22/05/24 3.7178 0.0168 1.25 ACT 22/05/25 3.5765 0.0363 2.50 ACT 21/05/26 3.4930 0.0246 3.00 ACT 18/04/28 3.5691 0.0251 2.25 ACT 22/05/29 3.6997 0.0298 1.75 ACT 17/05/30 3.8380 0.0400 1.75 ACT 23/10/31 3.9943 0.0390 2.50 ACT 22/10/32 4.0733 0.0450 4.50 ACT 23/10/34 4.1898 0.0495 1.00 NSW 08/02/24 3.8173 0.0012 5.00 NSW 20/08/24 3.6446 0.0037 1.25 NSW 20/03/25 3.5495 0.0300 4.00 NSW 20/05/26 3.4635 0.0244 3.00 NSW 20/05/27 3.4752 0.0202 3.00 NSW 20/03/28 3.5355 0.0283 3.00 NSW 15/11/28 3.5937 0.0256 3.00 NSW 20/04/29 3.6557 0.0319 3.00 NSW 20/02/30 3.7684 0.0431 6.00 NSW 01/05/30 3.7082 0.0385 1.25 NSW 20/11/30 3.8965 0.0410 2.00 NSW 20/03/31 3.9312 0.0461 1.50 NSW 20/02/32 4.0717 0.0505 2.50 NSW 22/11/32 4.0981 0.0470 2.00 NSW 08/03/33 4.1832 0.0463 3.50 NSW 20/03/34 4.2404 0.0473 1.75 NSW 20/03/34 4.3125 0.0400 4.75 NSW 20/02/35 4.3962 0.0544 4.25 NSW 20/02/36 4.4648 0.0492 3.50 NSW 20/11/37 4.6540 0.0568 2.25 NSW 20/11/40 4.8589 0.0450 2.25 NSW 07/05/41 4.8965 0.0452 2.25 NSW 20/05/42 4.8922 0.0455 2.45 NSW 24/08/50 4.9006 0.0440 6.00 NT 15/03/24 3.7395 0.0074 6.00 NT 15/03/26 3.4977 0.0253 2.75 NT 21/04/27 3.5453 0.0172 3.50 NT 21/04/28 3.5976 0.0234 2.00 NT 21/05/29 3.7603 0.0341 3.50 NT 21/05/30 3.9191 0.0373 Treasury Indexed Bond Tender Results of Tender Number TIB 245-9 May 2023 yieldbroker Series Repurchased: 0.75% 21 Nov 2027. Total tender size $150 min. Offers accepted $150 min. Weighted average offer: 0.5436%. Worst offer-Best offer: 0.6-0.52 (%). Number of offers allocated in full: 5. Total coverage ratio: 4.1667. Treasury Note Tender Results of Tender Number TN 16/23 - 4 May 2023 Maturity Date Allocated ($m) 1000 500 21 July 2023 22 September 2023 Cpn State Maturity Yield Chg% 2.50 NT 21/05/32 4.1929 0.0422 3.75 NT 21/04/33 4.3172 0.0420 4.50 NT 21/03/35 4.5210 0.0505 4.10 NT 21/11/42 4.9550 0.0412 4.25 QLD 21/07/23 3.8172 -0.0350 5.75 QLD 22/07/24 3.6444 0.0083 4.75 QLD 21/07/25 3.5462 0.0300 3.25 QLD 21/07/26 3.4580 0.0239 2.75 QLD 20/08/27 3.4763 0.0238 3.25 QLD 21/07/28 3.5239 0.0272 2.50 QLD 06/03/29 3.6087 0.0342 3.25 QLD 21/08/29 3.6545 0.0355 3.50 QLD 21/08/30 3.7595 0.0437 1.25 QLD 10/03/31 3.8762 0.0402 1.75 QLD 21/08/31 3.9037 0.0403 1.50 QLD 02/03/32 3.9867 0.0472 1.50 QLD 20/08/32 4.0299 0.0497 4.50 QLD 09/03/33 4.0407 0.0447 6.50 QLD 14/03/33 4.0575 0.0455 2.00 QLD 22/08/33 4.1337 0.0432 1.75 QLD 20/07/34 4.2625 0.0448 4.50 QLD 22/08/35 4.3300 0.0553 2.25 QLD 16/04/40 4.8042 0.0478 2.25 QLD 20/11/41 4.8493 0.0450 4.20 QLD 20/02/47 4.8389 0.0458 2.25 QLD 28/10/50 4.8353 0.0428 4.25 SA 20/11/23 3.8136 0.0050 2.25 SA 15/08/24 3.6072 0.0194 2.75 SA 16/04/25 3.5275 0.0348 3.00 SA 20/07/26 3.4517 0.0152 3.00 SA 20/09/27 3.5175 0.0235 3.00 SA 24/05/28 3.5690 0.0285 2.75 SA 24/05/30 3.7715 0.0395 1.75 SA 24/05/32 4.0657 0.0527 1.75 SA 24/05/34 4.3262 0.0515 2.00 SA 23/05/36 4.5253 0.0558 4.75 SA 24/05/38 4.6152 0.0465 2.25 SA 24/05/40 4.9165 0.0460 4.00 TAS 11/06/24 3.7533 0.0047 Yield (%) 3.857 3.8884 Yield Range (%) 3.98-3.79 4-3.835 Yield Che% Cpn State Maturity 3.25 TAS 24/01/28 3.4934 0.0223 2.00 TAS 24/01/30 3.7900 0.0350 2.25 TAS 22/01/32 4.0222 0.0462 2.50 TAS 21/01/33 4.1342 0.0455 4.00 TAS 20/01/34 4.2175 0.0467 1.75 TAS 22/01/36 4.4646 0.0469 2.35 TAS 23/08/41 5.0405 0.0425 4.35 TAS 02/05/46 5.1352 0.0420 5.50 VIC 17/12/24 3.6019 0.0139 0.50 VIC 20/11/25 3.5100 0.0275 5.50 VIC 17/11/26 3.4899 0.0255 1.25 VIC 19/11/27 3.5312 0.0204 3.00 VIC 20/10/28 3.6086 0.0316 2.50 VIC 22/10/29 3.7146 0.0349 1.50 VIC 20/11/30 3.8534 0.0444 4.75 VIC 20/11/30 3.8808 0.0440 1.50 VIC 10/09/31 3.9912 0.0438 4.25 VIC 20/12/32 4.1017 0.0518 2.25 VIC 15/09/33 4.2349 0.0465 2.25 VIC 20/11/34413 2.00 VIC 17/09/2 4.5042 0.00 4.75 VIC 15/09/3 4.5155 0.0428 2.00 VIC 20/11/3 4.6916 0.059 5.00 VIC 20/11/448395 0.050 2.25 VIC 20/11/40 4.91 0.0474 2.25 VIC 20/11/41 4.9568 0.0447 2.25 VIC 20/11/42 4.9653 0.0425 4.00 VIC 06/11/47 4.9079 0.0460 2.40 VIC 18/08/50 4.9173 0.0428 6.00 WA 16/10/23 3.8236 -0.0077 2.50 WA 23/07/24 3.6354 0.0095 5.00 WA 23/07/25 3.5250 0.0283 3.00 WA 21/10/26 3.4270 0.0219 3.00 WA 21/10/27 3.4463 0.0147 3.25 WA 20/07/28 3.5095 0.0331 2.75 WA 24/07/29 3.6335 0.0373 1.50 WA 22/10/30 3.7635 0.0450 1.75 WA 22/10/31 3.9051 0.0520 2.00 WA 24/10/34 4.2044 0.0464 AUSTRALIAN DOLLAR EXCHANGE RATES WHOLESALE MARKET CROSS RATES-MAJOR CURRENCIES sell/buy US, dollar 0.6767/0.6767 Norway, krone .... UK, pound.. 0.5358/0.5359 Pakistan, rupee....... Europe, euro Brunel, dollar Canada, dollar China, yuan Renminbi Denmark, kroner...... Fiji, dollar. French Pacific, franc. Hong Kong, dollar. India, rupees Indonesia, rupiah. Japan, yen.... 0.6153/0.6154 Papua NG, kina... 0.8857/0.9165 Philippines, peso 0.9049/0.9059 Saudi Arabla, ryl. 4.6889/4.6898 Singapore, dollar 4.5827/4.5835 Solomon Is, dollar 1.4798/1.4962 South Africa, rand... 12.4457/12.4515 73.28/73.90 Sri Lanka, rupee......214.861/219.187 5.3104/5.3109 Sweden, krona..... 55.467/55.566 Switzerland, franc.... .9985.19/9986.54 Thailand, baht. Malaysia, ringgit.. New Zealand, dollar.. 91.26/91.27 Tonga, pa'anga 3.0064/3.0098 Gold-1 oz, 1.0689/1.0690 6.8714/6.8738 0.6021/0.6021 .22.7962/22.8393 1.5556/1.6310 2985.60/2991.60 0.8966/0.8968 5.5694/5.6630 sell/buy Against 7.1227/7.1248 $NZ 192.32/193.07 USD 2.3512/2.4499 Sig. Euro. 37.716/37.717 2.5347/2.5411 Stranc.. Yen'000.. NZD 1 1.5791 1.9947 1.2630 USD Stg 0.6331 0.5013 1 0.7918 1 1.7368 1.0996 0.8707 1.7746 1.1235 0.8898 11.703 7.4154 5.8520 Euro Sfranc Yen 0.5757 0.5633 85.374 0.9093 0.8898 134.842 1.1484 1.1236 170.283 1 0.9784 1.0219 6.7410 1 148.280 151.535 6.5983 1 WHOLESALE MARKET US (Dow Jones) Fixed Interest Bonds. Treasury Bonds -55.69 to 33,618.69 US (Nasdaq) +21.50 to 12,256.92 3.25% US (S&P 500) +1.87 to 4138.12 0.25% 4.25% 0.50% 4.75% 2.75% AUSTRALIAN COMMODITIES UK (FTSE 100) 2.25% 2.75% 3.25% METALS May 8 May 9 +75.74 to 7778.38 2.75% 2.50% Gold Spot closing-$US (IRES) .. 2021.22 2023.76 Iron Ore 62% $US/t future (May 23). 107.73 106.60 Europe (EURO STOXX 50) 1.00% 1.50% Palladium $US/oz... 1705.23 1705.23 +8.22 to 4348.65 1.00% 1.25% Platinum $US/oz... 1082.51 1082.51 1.75% Japan (Nikkei 225) 4.50% LONDON METAL EXCHANGE May 5 May 8 +292.94 to 29,242.82 3.00% 3.75% Copper A sett tonne $US. 8535.0 8580.0 3.50% Tin H.G. sett tonne $US.. 25,755 26,050 New Zealand (NZX 50) 2.75% 3.75% Lead sett tonne $US. 2127.0 2107.0 -52.88 to 11,889.61 3.25% 2.75% Zinc S.H.G. sett tonne $US 2626.5 2681.0 Aluminium H.G. sett tonne $US. 2295.5 2321.0 Hong Kong (Hang Seng) 3.00% Nickel sett tonne $US... 24,000 24,705 -400.69 to 19,896.34 1.75% 3.00% 0.75% 2.50% OIL $US per bbl May 5 May 8 China (Shanghai A) 0.25% Cushing Futures.. WTI Crude Brent Crude -5.85 -5.85 -36.07 to 3522.91 2.00% 1.25% 71.34 73.16 1.00% Day % pa Coupon Maturity Chg % 2.75% 21/04/24 3.5985 0.0045 0.25% 21/11/24 3.3558 0.0363 21/04/25 3.2210 0.0410 21/11/25 3.0927 0.0312 21/04/26 3.0930 0.0283 21/09/26 3.0981 0.0206 21/04/27 3.1130 0.0267 21/11/27 3.1290 0.0297 21/05/28 3.1545 0.0325 21/11/28 3.1810 0.0317 21/04/29 3.2162 0.0379 21/11/29 3.2602 0.0387 21/05/30 3.3030 0.0440 21/12/30 3.3540 0.0465 21/06/31 3.3820 0.0500 21/11/31 3.4105 0.0480 21/05/32 3.4313 0.0488 21/11/32 3.4455 0.0500 21/04/33 3.4465 0.0500 21/11/33 3.4727 0.0507 21/05/34 3.4910 0.0500 21/12/34 3.5310 0.0505 21/06/35 3.5760 0.0513 21/04/37 3.7032 0.0547 21/06/39 3.8212 0.0540 21/05/41 3.8912 0.0412 21/03/47 3.9535 0.0465 21/06/51 3.9672 0.0397 20/09/25 0.0975 0.0182 21/11/27 0.5166 0.0154 20/09/30 0.9150 0.0263 21/11/32 1.1444 0.0425 21/08/35 1.2687 0.0382 21/08/40 1.5075 0.0425 21/02/50 1.6325 0.0415 Yield Data based on last available close of day for each market exchange time 75.30 77.01 Money, Overseas & Commodities Markets TREASURY BOND FUTURES TOP 200 - THE DAY'S BEST AND WORST INTEREST RATES Company Price Move % Company Price Move Prov Opening Price Trade Mineral Res 73.50 +209 +2.93 Charter Hall Gp 10.83 -48 -4.24 3-Year T-Bond Future (YT) Jun 23 Worley 16.47 +46 +2.87 Perseus Mining 2.14 -8 -3.60 Total Volume: 53480 96.920 96.910 96.910 96.910 96.920 -0.01 Previous O/P: 759933 SETTLEMENT High Low Price Change Volume 53480 759933 Prov May 2 May 9 O/P Cash Rate Overnight, average 11am rate. 3.6pc 3.85pc Allkem 12.83 +35 +2.80 Capricorn Metals 4.40 -16 -3.51 3-Year T-Bond Overnigh Put Options (YO) Exchange Traded Bonds Jun 23 0 Infratil 8.72 +21 +2.47 EVT 11.71 -40 -3.30 Total Volume: 0 Previous O/P:0 3 year (2026) close price. Macquarie Gp 177.43 +393 +2.27 Stockland 4.44 -14 -3.06 5 Year Treasury Bond Future (VT) Jun 23 96.865 96.825 -0.04 131 18226 5 year (2028) close price. Contact Energy 7.37 +16 +2.22 Core Lithium 1.00 -3 -2.91 Total Volume: 131 Previous O/P: 18226 10 year (2033) close price. 10-Year T-Bond Future (XT) BlueScope Steel 20.22 +41 +2.07 Lovisa Hldgs 25.28 -74 -2.84 Jun 23 Total Volume: 48320 96.550 96.550 96.550 96.540 96.550 Previous OVP: 1095591 0 48320 1096591 Insignia Fin 3.06 +6 +2.00 Nickel Industries .93 -2.5 -2.62 30 year (2051) close price.. International 103.64 103.15 96.36 96.78 110.52 109.00 64.17 63.50 20 Year Treasury Bond Future (LT) Pilbara Minerals 4.69 +9 +1.96 Telix Pharmaceutical 10.60 Jun 23 -28 -2.57 96.145 - 96.100 -0.045 1 15545 Total Volume: 1 Previous O/P: 15545 US Federal Funds rate per annum.... 4.83pc 5.08pc HUB24 27.73 +52 +1.91 BWP Trust 3.81 -10 -2.56 TREASURY TREASURY TENDERS Treasury Bond Tender Results of Tender Number TB 1441 - 3 May 2023 Series Offered: 4.50% 21 Apr 2033. Amount offered $800 min. Amount allotted $800 min. Weighted average bid: 3.394%. Worst bid-Best bid: 3.47-3.3575 (%). Number of bids allocated in full: 16. Coverage ratio: 4.1063. Results of Tender Number TB 1440 - 12 April 2023 Series Offered: 3.25% 21 Apr 2029. Amount offered $800 min. Amount allotted $800 min. Weighted average bid: 3.0378%. Worst bid-Best bid: 3.075-3.025 (%). Number of bids allocated in full: 14. Coverage ratio: 2.37. Indicative mid-rates of selected Australian All yields in this table are closing rates. Semi-Government Bonds Cpn State Maturity Yield Che% 4.00 ACT 22/05/24 3.7178 0.0168 1.25 ACT 22/05/25 3.5765 0.0363 2.50 ACT 21/05/26 3.4930 0.0246 3.00 ACT 18/04/28 3.5691 0.0251 2.25 ACT 22/05/29 3.6997 0.0298 1.75 ACT 17/05/30 3.8380 0.0400 1.75 ACT 23/10/31 3.9943 0.0390 2.50 ACT 22/10/32 4.0733 0.0450 4.50 ACT 23/10/34 4.1898 0.0495 1.00 NSW 08/02/24 3.8173 0.0012 5.00 NSW 20/08/24 3.6446 0.0037 1.25 NSW 20/03/25 3.5495 0.0300 4.00 NSW 20/05/26 3.4635 0.0244 3.00 NSW 20/05/27 3.4752 0.0202 3.00 NSW 20/03/28 3.5355 0.0283 3.00 NSW 15/11/28 3.5937 0.0256 3.00 NSW 20/04/29 3.6557 0.0319 3.00 NSW 20/02/30 3.7684 0.0431 6.00 NSW 01/05/30 3.7082 0.0385 1.25 NSW 20/11/30 3.8965 0.0410 2.00 NSW 20/03/31 3.9312 0.0461 1.50 NSW 20/02/32 4.0717 0.0505 2.50 NSW 22/11/32 4.0981 0.0470 2.00 NSW 08/03/33 4.1832 0.0463 3.50 NSW 20/03/34 4.2404 0.0473 1.75 NSW 20/03/34 4.3125 0.0400 4.75 NSW 20/02/35 4.3962 0.0544 4.25 NSW 20/02/36 4.4648 0.0492 3.50 NSW 20/11/37 4.6540 0.0568 2.25 NSW 20/11/40 4.8589 0.0450 2.25 NSW 07/05/41 4.8965 0.0452 2.25 NSW 20/05/42 4.8922 0.0455 2.45 NSW 24/08/50 4.9006 0.0440 6.00 NT 15/03/24 3.7395 0.0074 6.00 NT 15/03/26 3.4977 0.0253 2.75 NT 21/04/27 3.5453 0.0172 3.50 NT 21/04/28 3.5976 0.0234 2.00 NT 21/05/29 3.7603 0.0341 3.50 NT 21/05/30 3.9191 0.0373 Treasury Indexed Bond Tender Results of Tender Number TIB 245-9 May 2023 yieldbroker Series Repurchased: 0.75% 21 Nov 2027. Total tender size $150 min. Offers accepted $150 min. Weighted average offer: 0.5436%. Worst offer-Best offer: 0.6-0.52 (%). Number of offers allocated in full: 5. Total coverage ratio: 4.1667. Treasury Note Tender Results of Tender Number TN 16/23 - 4 May 2023 Maturity Date Allocated ($m) 1000 500 21 July 2023 22 September 2023 Cpn State Maturity Yield Chg% 2.50 NT 21/05/32 4.1929 0.0422 3.75 NT 21/04/33 4.3172 0.0420 4.50 NT 21/03/35 4.5210 0.0505 4.10 NT 21/11/42 4.9550 0.0412 4.25 QLD 21/07/23 3.8172 -0.0350 5.75 QLD 22/07/24 3.6444 0.0083 4.75 QLD 21/07/25 3.5462 0.0300 3.25 QLD 21/07/26 3.4580 0.0239 2.75 QLD 20/08/27 3.4763 0.0238 3.25 QLD 21/07/28 3.5239 0.0272 2.50 QLD 06/03/29 3.6087 0.0342 3.25 QLD 21/08/29 3.6545 0.0355 3.50 QLD 21/08/30 3.7595 0.0437 1.25 QLD 10/03/31 3.8762 0.0402 1.75 QLD 21/08/31 3.9037 0.0403 1.50 QLD 02/03/32 3.9867 0.0472 1.50 QLD 20/08/32 4.0299 0.0497 4.50 QLD 09/03/33 4.0407 0.0447 6.50 QLD 14/03/33 4.0575 0.0455 2.00 QLD 22/08/33 4.1337 0.0432 1.75 QLD 20/07/34 4.2625 0.0448 4.50 QLD 22/08/35 4.3300 0.0553 2.25 QLD 16/04/40 4.8042 0.0478 2.25 QLD 20/11/41 4.8493 0.0450 4.20 QLD 20/02/47 4.8389 0.0458 2.25 QLD 28/10/50 4.8353 0.0428 4.25 SA 20/11/23 3.8136 0.0050 2.25 SA 15/08/24 3.6072 0.0194 2.75 SA 16/04/25 3.5275 0.0348 3.00 SA 20/07/26 3.4517 0.0152 3.00 SA 20/09/27 3.5175 0.0235 3.00 SA 24/05/28 3.5690 0.0285 2.75 SA 24/05/30 3.7715 0.0395 1.75 SA 24/05/32 4.0657 0.0527 1.75 SA 24/05/34 4.3262 0.0515 2.00 SA 23/05/36 4.5253 0.0558 4.75 SA 24/05/38 4.6152 0.0465 2.25 SA 24/05/40 4.9165 0.0460 4.00 TAS 11/06/24 3.7533 0.0047 Yield (%) 3.857 3.8884 Yield Range (%) 3.98-3.79 4-3.835 Yield Che% Cpn State Maturity 3.25 TAS 24/01/28 3.4934 0.0223 2.00 TAS 24/01/30 3.7900 0.0350 2.25 TAS 22/01/32 4.0222 0.0462 2.50 TAS 21/01/33 4.1342 0.0455 4.00 TAS 20/01/34 4.2175 0.0467 1.75 TAS 22/01/36 4.4646 0.0469 2.35 TAS 23/08/41 5.0405 0.0425 4.35 TAS 02/05/46 5.1352 0.0420 5.50 VIC 17/12/24 3.6019 0.0139 0.50 VIC 20/11/25 3.5100 0.0275 5.50 VIC 17/11/26 3.4899 0.0255 1.25 VIC 19/11/27 3.5312 0.0204 3.00 VIC 20/10/28 3.6086 0.0316 2.50 VIC 22/10/29 3.7146 0.0349 1.50 VIC 20/11/30 3.8534 0.0444 4.75 VIC 20/11/30 3.8808 0.0440 1.50 VIC 10/09/31 3.9912 0.0438 4.25 VIC 20/12/32 4.1017 0.0518 2.25 VIC 15/09/33 4.2349 0.0465 2.25 VIC 20/11/34413 2.00 VIC 17/09/2 4.5042 0.00 4.75 VIC 15/09/3 4.5155 0.0428 2.00 VIC 20/11/3 4.6916 0.059 5.00 VIC 20/11/448395 0.050 2.25 VIC 20/11/40 4.91 0.0474 2.25 VIC 20/11/41 4.9568 0.0447 2.25 VIC 20/11/42 4.9653 0.0425 4.00 VIC 06/11/47 4.9079 0.0460 2.40 VIC 18/08/50 4.9173 0.0428 6.00 WA 16/10/23 3.8236 -0.0077 2.50 WA 23/07/24 3.6354 0.0095 5.00 WA 23/07/25 3.5250 0.0283 3.00 WA 21/10/26 3.4270 0.0219 3.00 WA 21/10/27 3.4463 0.0147 3.25 WA 20/07/28 3.5095 0.0331 2.75 WA 24/07/29 3.6335 0.0373 1.50 WA 22/10/30 3.7635 0.0450 1.75 WA 22/10/31 3.9051 0.0520 2.00 WA 24/10/34 4.2044 0.0464 AUSTRALIAN DOLLAR EXCHANGE RATES WHOLESALE MARKET CROSS RATES-MAJOR CURRENCIES sell/buy US, dollar 0.6767/0.6767 Norway, krone .... UK, pound.. 0.5358/0.5359 Pakistan, rupee....... Europe, euro Brunel, dollar Canada, dollar China, yuan Renminbi Denmark, kroner...... Fiji, dollar. French Pacific, franc. Hong Kong, dollar. India, rupees Indonesia, rupiah. Japan, yen.... 0.6153/0.6154 Papua NG, kina... 0.8857/0.9165 Philippines, peso 0.9049/0.9059 Saudi Arabla, ryl. 4.6889/4.6898 Singapore, dollar 4.5827/4.5835 Solomon Is, dollar 1.4798/1.4962 South Africa, rand... 12.4457/12.4515 73.28/73.90 Sri Lanka, rupee......214.861/219.187 5.3104/5.3109 Sweden, krona..... 55.467/55.566 Switzerland, franc.... .9985.19/9986.54 Thailand, baht. Malaysia, ringgit.. New Zealand, dollar.. 91.26/91.27 Tonga, pa'anga 3.0064/3.0098 Gold-1 oz, 1.0689/1.0690 6.8714/6.8738 0.6021/0.6021 .22.7962/22.8393 1.5556/1.6310 2985.60/2991.60 0.8966/0.8968 5.5694/5.6630 sell/buy Against 7.1227/7.1248 $NZ 192.32/193.07 USD 2.3512/2.4499 Sig. Euro. 37.716/37.717 2.5347/2.5411 Stranc.. Yen'000.. NZD 1 1.5791 1.9947 1.2630 USD Stg 0.6331 0.5013 1 0.7918 1 1.7368 1.0996 0.8707 1.7746 1.1235 0.8898 11.703 7.4154 5.8520 Euro Sfranc Yen 0.5757 0.5633 85.374 0.9093 0.8898 134.842 1.1484 1.1236 170.283 1 0.9784 1.0219 6.7410 1 148.280 151.535 6.5983 1 WHOLESALE MARKET US (Dow Jones) Fixed Interest Bonds. Treasury Bonds -55.69 to 33,618.69 US (Nasdaq) +21.50 to 12,256.92 3.25% US (S&P 500) +1.87 to 4138.12 0.25% 4.25% 0.50% 4.75% 2.75% AUSTRALIAN COMMODITIES UK (FTSE 100) 2.25% 2.75% 3.25% METALS May 8 May 9 +75.74 to 7778.38 2.75% 2.50% Gold Spot closing-$US (IRES) .. 2021.22 2023.76 Iron Ore 62% $US/t future (May 23). 107.73 106.60 Europe (EURO STOXX 50) 1.00% 1.50% Palladium $US/oz... 1705.23 1705.23 +8.22 to 4348.65 1.00% 1.25% Platinum $US/oz... 1082.51 1082.51 1.75% Japan (Nikkei 225) 4.50% LONDON METAL EXCHANGE May 5 May 8 +292.94 to 29,242.82 3.00% 3.75% Copper A sett tonne $US. 8535.0 8580.0 3.50% Tin H.G. sett tonne $US.. 25,755 26,050 New Zealand (NZX 50) 2.75% 3.75% Lead sett tonne $US. 2127.0 2107.0 -52.88 to 11,889.61 3.25% 2.75% Zinc S.H.G. sett tonne $US 2626.5 2681.0 Aluminium H.G. sett tonne $US. 2295.5 2321.0 Hong Kong (Hang Seng) 3.00% Nickel sett tonne $US... 24,000 24,705 -400.69 to 19,896.34 1.75% 3.00% 0.75% 2.50% OIL $US per bbl May 5 May 8 China (Shanghai A) 0.25% Cushing Futures.. WTI Crude Brent Crude -5.85 -5.85 -36.07 to 3522.91 2.00% 1.25% 71.34 73.16 1.00% Day % pa Coupon Maturity Chg % 2.75% 21/04/24 3.5985 0.0045 0.25% 21/11/24 3.3558 0.0363 21/04/25 3.2210 0.0410 21/11/25 3.0927 0.0312 21/04/26 3.0930 0.0283 21/09/26 3.0981 0.0206 21/04/27 3.1130 0.0267 21/11/27 3.1290 0.0297 21/05/28 3.1545 0.0325 21/11/28 3.1810 0.0317 21/04/29 3.2162 0.0379 21/11/29 3.2602 0.0387 21/05/30 3.3030 0.0440 21/12/30 3.3540 0.0465 21/06/31 3.3820 0.0500 21/11/31 3.4105 0.0480 21/05/32 3.4313 0.0488 21/11/32 3.4455 0.0500 21/04/33 3.4465 0.0500 21/11/33 3.4727 0.0507 21/05/34 3.4910 0.0500 21/12/34 3.5310 0.0505 21/06/35 3.5760 0.0513 21/04/37 3.7032 0.0547 21/06/39 3.8212 0.0540 21/05/41 3.8912 0.0412 21/03/47 3.9535 0.0465 21/06/51 3.9672 0.0397 20/09/25 0.0975 0.0182 21/11/27 0.5166 0.0154 20/09/30 0.9150 0.0263 21/11/32 1.1444 0.0425 21/08/35 1.2687 0.0382 21/08/40 1.5075 0.0425 21/02/50 1.6325 0.0415 Yield Data based on last available close of day for each market exchange time 75.30 77.01
Expert Answer:

Related Book For 
An Introduction To Financial Markets A Quantitative Approach
ISBN: 9781118014776
1st Edition
Authors: Paolo Brandimarte
Posted Date:
Students also viewed these finance questions
-
13. What is a lower bound for the price of 3-month call option on a non- dividend-paying stock when the stock price is $50, the strike price is $45, and the 3-month risk-free interest rate is 8%?...
-
Question Data Case for Chapter 11: Optimal Portfolio Choice and the Capital Asset Pricing Model Your manager was so impressed with your work analyzing the return and standard deviations of the 12...
-
Let A, B be sets. Define: (a) the Cartesian product (A B) (b) the set of relations R between A and B (c) the identity relation A on the set A [3 marks] Suppose S, T are relations between A and B, and...
-
No Opportunity Costs The Van Division of MotoCar Corporation has offered to purchase 180,000 wheels from the Wheel Division for $41 per wheel. At a normal volume of 500,000 wheels per year,...
-
Give some examples of times in the project lifecycle when an inspection might be especially useful.
-
In late 2012, the U.S. Treasury sold the last of the stock it had purchased in the insurance company AIG. The Treasury earned a profit on the $22.7 billion it had invested in AIG in 2008. An article...
-
An asset costs 15,000, has a residual value of 1,000 and an estimated useful life of five years. Using the reducing balance method and a 40 percent rate per annum, what is the assets net book value...
-
A simplified representation for cooling in very large-scale integration (VLSI) of microelectronics is shown in the sketch. A silicon chip is mounted in a dielectric substrate, and one surface of the...
-
Oscar Incorporated has issued 40,000 shares of stock, 30,000 of which are held by Romeo Corporation. Romeo would like to have a significant influence on Oscar Incorporated. Which of the following...
-
Blue Ridge Marketing Inc. manufactures two products, A and B.Presently, the company uses a single plantwide factory overheadrate for allocating overhead to products. However, management isconsideri 0...
-
Successful food & beverage (F&B) operations are consistently monitoring performance through various operating metrics, key performance indicators (KPIs) and financial ratios. This approach allows...
-
Analyse incitec pivot limited (IPL) historical financial performance. Use these 3 ratios Price-to-Earnings Ratio (P/E Ratio), Gross Profit Margin and Current Ratio. Explain their significance for the...
-
Design a second order system with a stable focus and a stable limit cycle. You may use polar coordinates, but the final system equations should be given in the Cartesian coordinates.
-
Describe the sources of information that could be utilized to inform these three (3) types of budgets, example at ACA Travel for internal and external methods of communication. How the sources of...
-
Discuss why the sovereign debt of emerging economies could be destabilising for the global economy
-
The management of Mecca Copy, a photocopying center located on University Avenue, has compiled the following data to use in preparing its budgeted balance sheet for next year: Ending Balances Cash ?...
-
Find the equation of the plane passing through the points P 5,4,3 ,Q 4,3,1 and R 1,5,4
-
The standard costs for a manufacturing business are \($12\) per unit for direct materials, \($8\) per unit for direct labour, and \($5\) per unit for manufacturing overhead. The sales projection is...
-
What is Munchs expected profit for April? a. $192,500 b. $56,000 c. $66,000 d. $59,000 Munch Enterprises makes a small toy car that is voice activated. Projected sales for the next four months are...
-
Bobby Jones Inc. is planning sales of 55,000 units for the next three months. The company has a beginning inventory of 10,000 units and would like to have an ending inventory of 15,000 at the end of...

Study smarter with the SolutionInn App