Answered step by step
Verified Expert Solution
Question
1 Approved Answer
Prepare a brief report for the managing director to help explain what has happened to Al Trade during the year 2018 and comment on the

Prepare a brief report for the managing director to help explain what has happened to Al Trade during the year 2018 and comment on the significance of your findings.
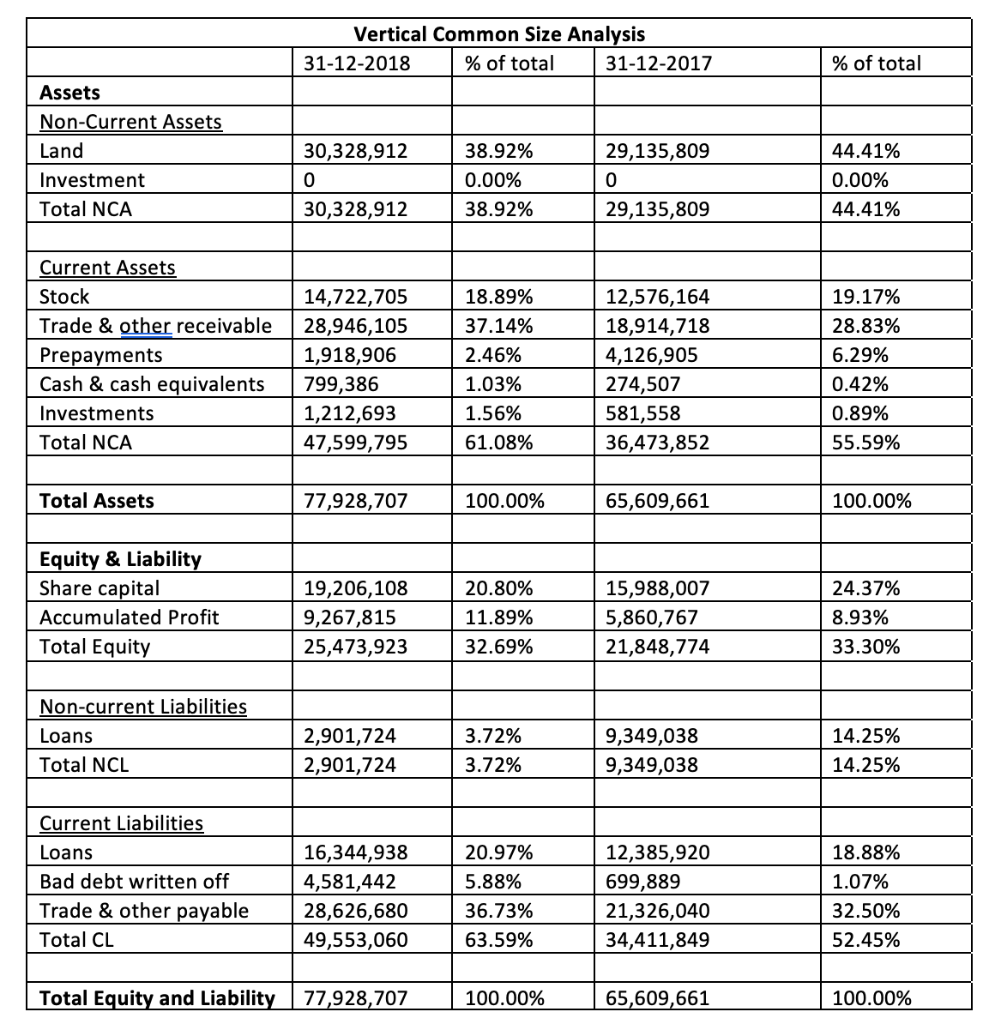
Vertical Common Size Analysis 31-12-2018 % of total 31-12-2017 % of total Assets Non-Current Assets Land Investment Total NCA 30,328,912 0 30,328,912 38.92% 0.00% 38.92% 29,135,809 0 29,135,809 44.41% 0.00% 44.41% Current Assets Stock Trade & other receivable Prepayments Cash & cash equivalents Investments Total NCA 14,722,705 28,946,105 1,918,906 799,386 1,212,693 47,599,795 18.89% 37.14% 2.46% 1.03% 1.56% 61.08% 12,576,164 18,914,718 4,126,905 274,507 581,558 36,473,852 19.17% 28.83% 6.29% 0.42% 0.89% 55.59% Total Assets 77,928,707 100.00% 65,609,661 100.00% Equity & Liability Share capital Accumulated Profit Total Equity 19,206,108 9,267,815 25,473,923 20.80% 11.89% 32.69% 15,988,007 5,860,767 21,848,774 24.37% 8.93% 33.30% Non-current Liabilities Loans Total NCL 2,901,724 2,901,724 3.72% 3.72% 9,349,038 9,349,038 14.25% 14.25% Current Liabilities Loans Bad debt written off Trade & other payable Total CL 16,344,938 4,581,442 28,626,680 49,553,060 20.97% 5.88% 36.73% 63.59% 12,385,920 699,889 21,326,040 34,411,849 18.88% 1.07% 32.50% 52.45% Total Equity and Liability 77,928,707 100.00% 65,609,661 100.00%Step by Step Solution
There are 3 Steps involved in it
Step: 1

Get Instant Access to Expert-Tailored Solutions
See step-by-step solutions with expert insights and AI powered tools for academic success
Step: 2

Step: 3

Ace Your Homework with AI
Get the answers you need in no time with our AI-driven, step-by-step assistance
Get Started


