Answered step by step
Verified Expert Solution
Question
1 Approved Answer
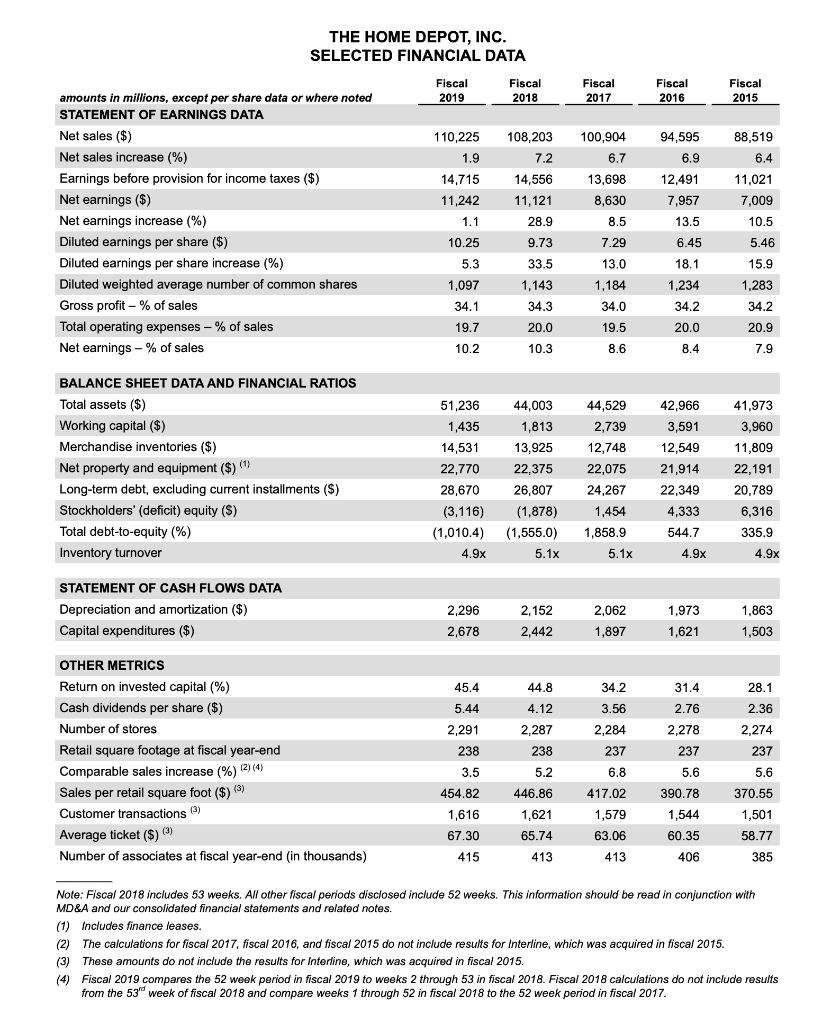
Prepare a horizontal analysis of each item on the balance sheet and income statement comparing the last two years. Prepare a vertical analysis of each

Prepare a horizontal analysis of each item on the balance sheet and income statement comparing the last two years.
Prepare a vertical analysis of each item on the last two years of the income statement and balance sheet.
THE HOME DEPOT, INC. SELECTED FINANCIAL DATA Fiscal 2019 Fiscal 2018 Fiscal 2017 Fiscal 2016 Fiscal 2015 110,225 1.9 14,715 11,242 1.1 10.25 amounts in millions, except per share data or where noted STATEMENT OF EARNINGS DATA Net sales ($) $ Net sales increase (%) ) Earnings before provision for income taxes ($) Net earnings ($) Net earnings increase (%) Diluted earnings per share ($) Diluted earnings per share increase (%) Diluted weighted average number of common shares Gross profit - % of sales Total operating expenses -% of sales Net earnings - % of sales 108,203 7.2 14,556 11,121 28.9 100,904 6.7 13,698 8,630 94,595 6.9 12,491 7,957 88,519 6.4 11,021 7,009 10.5 5.46 8.5 13.5 9.73 7.29 6.45 5.3 18.1 33.5 1,143 13.0 1,184 1,234 15.9 1,283 34.2 34.3 34.2 1,097 34.1 19.7 10.2 34.0 19.5 20.0 20.0 20.9 10.3 8.6 8.4 7.9 44,529 2,739 BALANCE SHEET DATA AND FINANCIAL RATIOS Total assets ($) Working capital ($) Merchandise inventories ($) Net property and equipment ($) (1) Long-term debt, excluding current installments ($) Stockholders' (deficit) equity (S) Total debt-to-equity (%) Inventory turnover 51,236 44,003 1,435 1,813 14,531 13,925 22,770 22,375 28,670 26,807 (3,116) (1,878) (1,010.4) (1,555.0) 4.9x 5.1x 12,748 22,075 24,267 1,454 1,858.9 5.1x 42,966 3,591 12,549 21,914 22,349 4,333 544.7 4.9x 41,973 3,960 11,809 22,191 20,789 6,316 335.9 4.9x STATEMENT OF CASH FLOWS DATA Depreciation and amortization ($) Capital expenditures ($) 2,296 2,678 2,152 2,442 2,062 1,897 1,973 1,621 1,863 1,503 45.4 34.2 31.4 5.44 44.8 4.12 2,287 3.56 28.1 2.36 2,274 237 2.76 2,278 237 2,291 238 238 OTHER METRICS Return on invested capital (%) Cash dividends per share ($) Number of stores Retail square footage at fiscal year-end Comparable sales increase (%) 21 (1) Sales per retail square foot ($) (3) Customer transactions (3) Average ticket ($)(?) Number of associates at fiscal year-end (in thousands) 2,284 237 6.8 417.02 5.2 5.6 446.86 370.55 3.5 454.82 1,616 67.30 415 5.6 390.78 1,544 60.35 1,621 65.74 413 1,579 63.06 1,501 58.77 413 406 385 Note: Fiscal 2018 includes 53 weeks. All other fiscal periods disclosed include 52 weeks. This information should be read in conjunction with MD&A and our consolidated financial statements and related notes. (1) Includes finance leases. (2) The calculations for fiscal 2017, fiscal 2016, and fiscal 2015 do not include results for Interline, which was acquired fiscal 2015 (3) These amounts do not include the results for Interline, which was acquired in fiscal 2015. (4) Fiscal 2019 compares the 52 week period in fiscal 2019 to weeks 2 through 53 in fiscal 2018. Fiscal 2018 calculations do not include results from the 53' week of fiscal 2018 and compare weeks 1 through 52 in fiscal 2018 to the 52 week period in fiscal 2017. THE HOME DEPOT, INC. SELECTED FINANCIAL DATA Fiscal 2019 Fiscal 2018 Fiscal 2017 Fiscal 2016 Fiscal 2015 110,225 1.9 14,715 11,242 1.1 10.25 amounts in millions, except per share data or where noted STATEMENT OF EARNINGS DATA Net sales ($) $ Net sales increase (%) ) Earnings before provision for income taxes ($) Net earnings ($) Net earnings increase (%) Diluted earnings per share ($) Diluted earnings per share increase (%) Diluted weighted average number of common shares Gross profit - % of sales Total operating expenses -% of sales Net earnings - % of sales 108,203 7.2 14,556 11,121 28.9 100,904 6.7 13,698 8,630 94,595 6.9 12,491 7,957 88,519 6.4 11,021 7,009 10.5 5.46 8.5 13.5 9.73 7.29 6.45 5.3 18.1 33.5 1,143 13.0 1,184 1,234 15.9 1,283 34.2 34.3 34.2 1,097 34.1 19.7 10.2 34.0 19.5 20.0 20.0 20.9 10.3 8.6 8.4 7.9 44,529 2,739 BALANCE SHEET DATA AND FINANCIAL RATIOS Total assets ($) Working capital ($) Merchandise inventories ($) Net property and equipment ($) (1) Long-term debt, excluding current installments ($) Stockholders' (deficit) equity (S) Total debt-to-equity (%) Inventory turnover 51,236 44,003 1,435 1,813 14,531 13,925 22,770 22,375 28,670 26,807 (3,116) (1,878) (1,010.4) (1,555.0) 4.9x 5.1x 12,748 22,075 24,267 1,454 1,858.9 5.1x 42,966 3,591 12,549 21,914 22,349 4,333 544.7 4.9x 41,973 3,960 11,809 22,191 20,789 6,316 335.9 4.9x STATEMENT OF CASH FLOWS DATA Depreciation and amortization ($) Capital expenditures ($) 2,296 2,678 2,152 2,442 2,062 1,897 1,973 1,621 1,863 1,503 45.4 34.2 31.4 5.44 44.8 4.12 2,287 3.56 28.1 2.36 2,274 237 2.76 2,278 237 2,291 238 238 OTHER METRICS Return on invested capital (%) Cash dividends per share ($) Number of stores Retail square footage at fiscal year-end Comparable sales increase (%) 21 (1) Sales per retail square foot ($) (3) Customer transactions (3) Average ticket ($)(?) Number of associates at fiscal year-end (in thousands) 2,284 237 6.8 417.02 5.2 5.6 446.86 370.55 3.5 454.82 1,616 67.30 415 5.6 390.78 1,544 60.35 1,621 65.74 413 1,579 63.06 1,501 58.77 413 406 385 Note: Fiscal 2018 includes 53 weeks. All other fiscal periods disclosed include 52 weeks. This information should be read in conjunction with MD&A and our consolidated financial statements and related notes. (1) Includes finance leases. (2) The calculations for fiscal 2017, fiscal 2016, and fiscal 2015 do not include results for Interline, which was acquired fiscal 2015 (3) These amounts do not include the results for Interline, which was acquired in fiscal 2015. (4) Fiscal 2019 compares the 52 week period in fiscal 2019 to weeks 2 through 53 in fiscal 2018. Fiscal 2018 calculations do not include results from the 53' week of fiscal 2018 and compare weeks 1 through 52 in fiscal 2018 to the 52 week period in fiscal 2017Step by Step Solution
There are 3 Steps involved in it
Step: 1

Get Instant Access to Expert-Tailored Solutions
See step-by-step solutions with expert insights and AI powered tools for academic success
Step: 2

Step: 3

Ace Your Homework with AI
Get the answers you need in no time with our AI-driven, step-by-step assistance
Get Started


