Answered step by step
Verified Expert Solution
Link Copied!

Question

1 Approved Answer

Prepare a Proforma Statement for years 1996, 1997, 1998, 1999, 2000, 2001 Exhibit 13 (continued) Income Statement (000s) Historical Fiscal Years Ended December 31 1994

Prepare a Proforma Statement for years 1996, 1997, 1998, 1999, 2000, 2001image text in transcribed

Exhibit 13 (continued) Income Statement (000s) Historical Fiscal Years Ended December 31 1994 995 996 8,345 15,335 29,493 Total Revenue 11,024 other Expenses Adjustments 6,831 Total Cost of Sales Gross Profit ,514 4,3 8,982 Marketing & Advertising 320 875 2,58 General & Administrative 3,290 3,344 5,432 (2,096) 91 969 EBITDA Amortization and Depreciation EBIT (2,199) (45) Interest Expense Notes Payable 8.5% Current Maturities 8.5% Interest Income (Excess Cash) 5.0% Subordinated Debt 9.0% Total Interest Expense/(Income) 53 139 301 (2,252) (184) 421 Earnings Before Taxes Income Tax Expense 39,6% Net Income (Loss) Projected Years Ending December 31 1997 1998 1999 50,026 93,700 69.717 32,780 32,780 17,246 26,634 35,796 11,529 5,60 9,238 9,410 2,785 6,808 2,234 4,610 7,459 6,964 2,025 4,279 337 323 323 (95) (187) 405 432 340 1,620 3,847 6,624 2000 122,981 46,982 14,069 21,569 11,344 10,633 323 182 10,451 200 148,499 91,769 56,730 5,819 25,450 5.46 4.698 323 (601) (74) 14,772 2002 174,635 107,920 107,920 66,715 17,345 29,23 20,139 19,192 323 (996) (469) 19,661 Exhibit 13 (continued) Income Statement (000s) Historical Fiscal Years Ended December 31 1994 995 996 8,345 15,335 29,493 Total Revenue 11,024 other Expenses Adjustments 6,831 Total Cost of Sales Gross Profit ,514 4,3 8,982 Marketing & Advertising 320 875 2,58 General & Administrative 3,290 3,344 5,432 (2,096) 91 969 EBITDA Amortization and Depreciation EBIT (2,199) (45) Interest Expense Notes Payable 8.5% Current Maturities 8.5% Interest Income (Excess Cash) 5.0% Subordinated Debt 9.0% Total Interest Expense/(Income) 53 139 301 (2,252) (184) 421 Earnings Before Taxes Income Tax Expense 39,6% Net Income (Loss) Projected Years Ending December 31 1997 1998 1999 50,026 93,700 69.717 32,780 32,780 17,246 26,634 35,796 11,529 5,60 9,238 9,410 2,785 6,808 2,234 4,610 7,459 6,964 2,025 4,279 337 323 323 (95) (187) 405 432 340 1,620 3,847 6,624 2000 122,981 46,982 14,069 21,569 11,344 10,633 323 182 10,451 200 148,499 91,769 56,730 5,819 25,450 5.46 4.698 323 (601) (74) 14,772 2002 174,635 107,920 107,920 66,715 17,345 29,23 20,139 19,192 323 (996) (469) 19,661

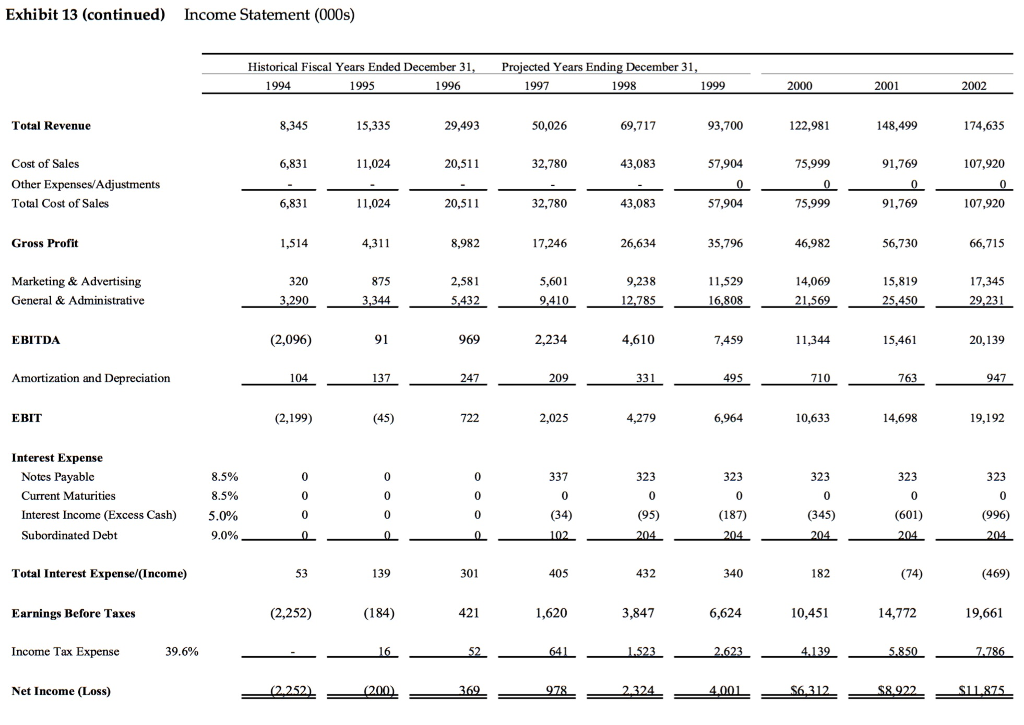
Step by Step Solution

There are 3 Steps involved in it

Step: 1

blur-text-image

Get Instant Access to Expert-Tailored Solutions

See step-by-step solutions with expert insights and AI powered tools for academic success

Step: 2

blur-text-image

Step: 3

blur-text-image

Ace Your Homework with AI

Get the answers you need in no time with our AI-driven, step-by-step assistance

Get Started

Recommended Textbook for

Marketing For Financial Advisors

Authors: Eric Bradlow, Keith Niedermeier, Patti Williams

1st Edition

0071605142, 978-0071605144

More Books

Students also viewed these Finance questions

Question

What is operations management? Plo8

Answered: 1 week ago

Question

Why We Listen?

Answered: 1 week ago