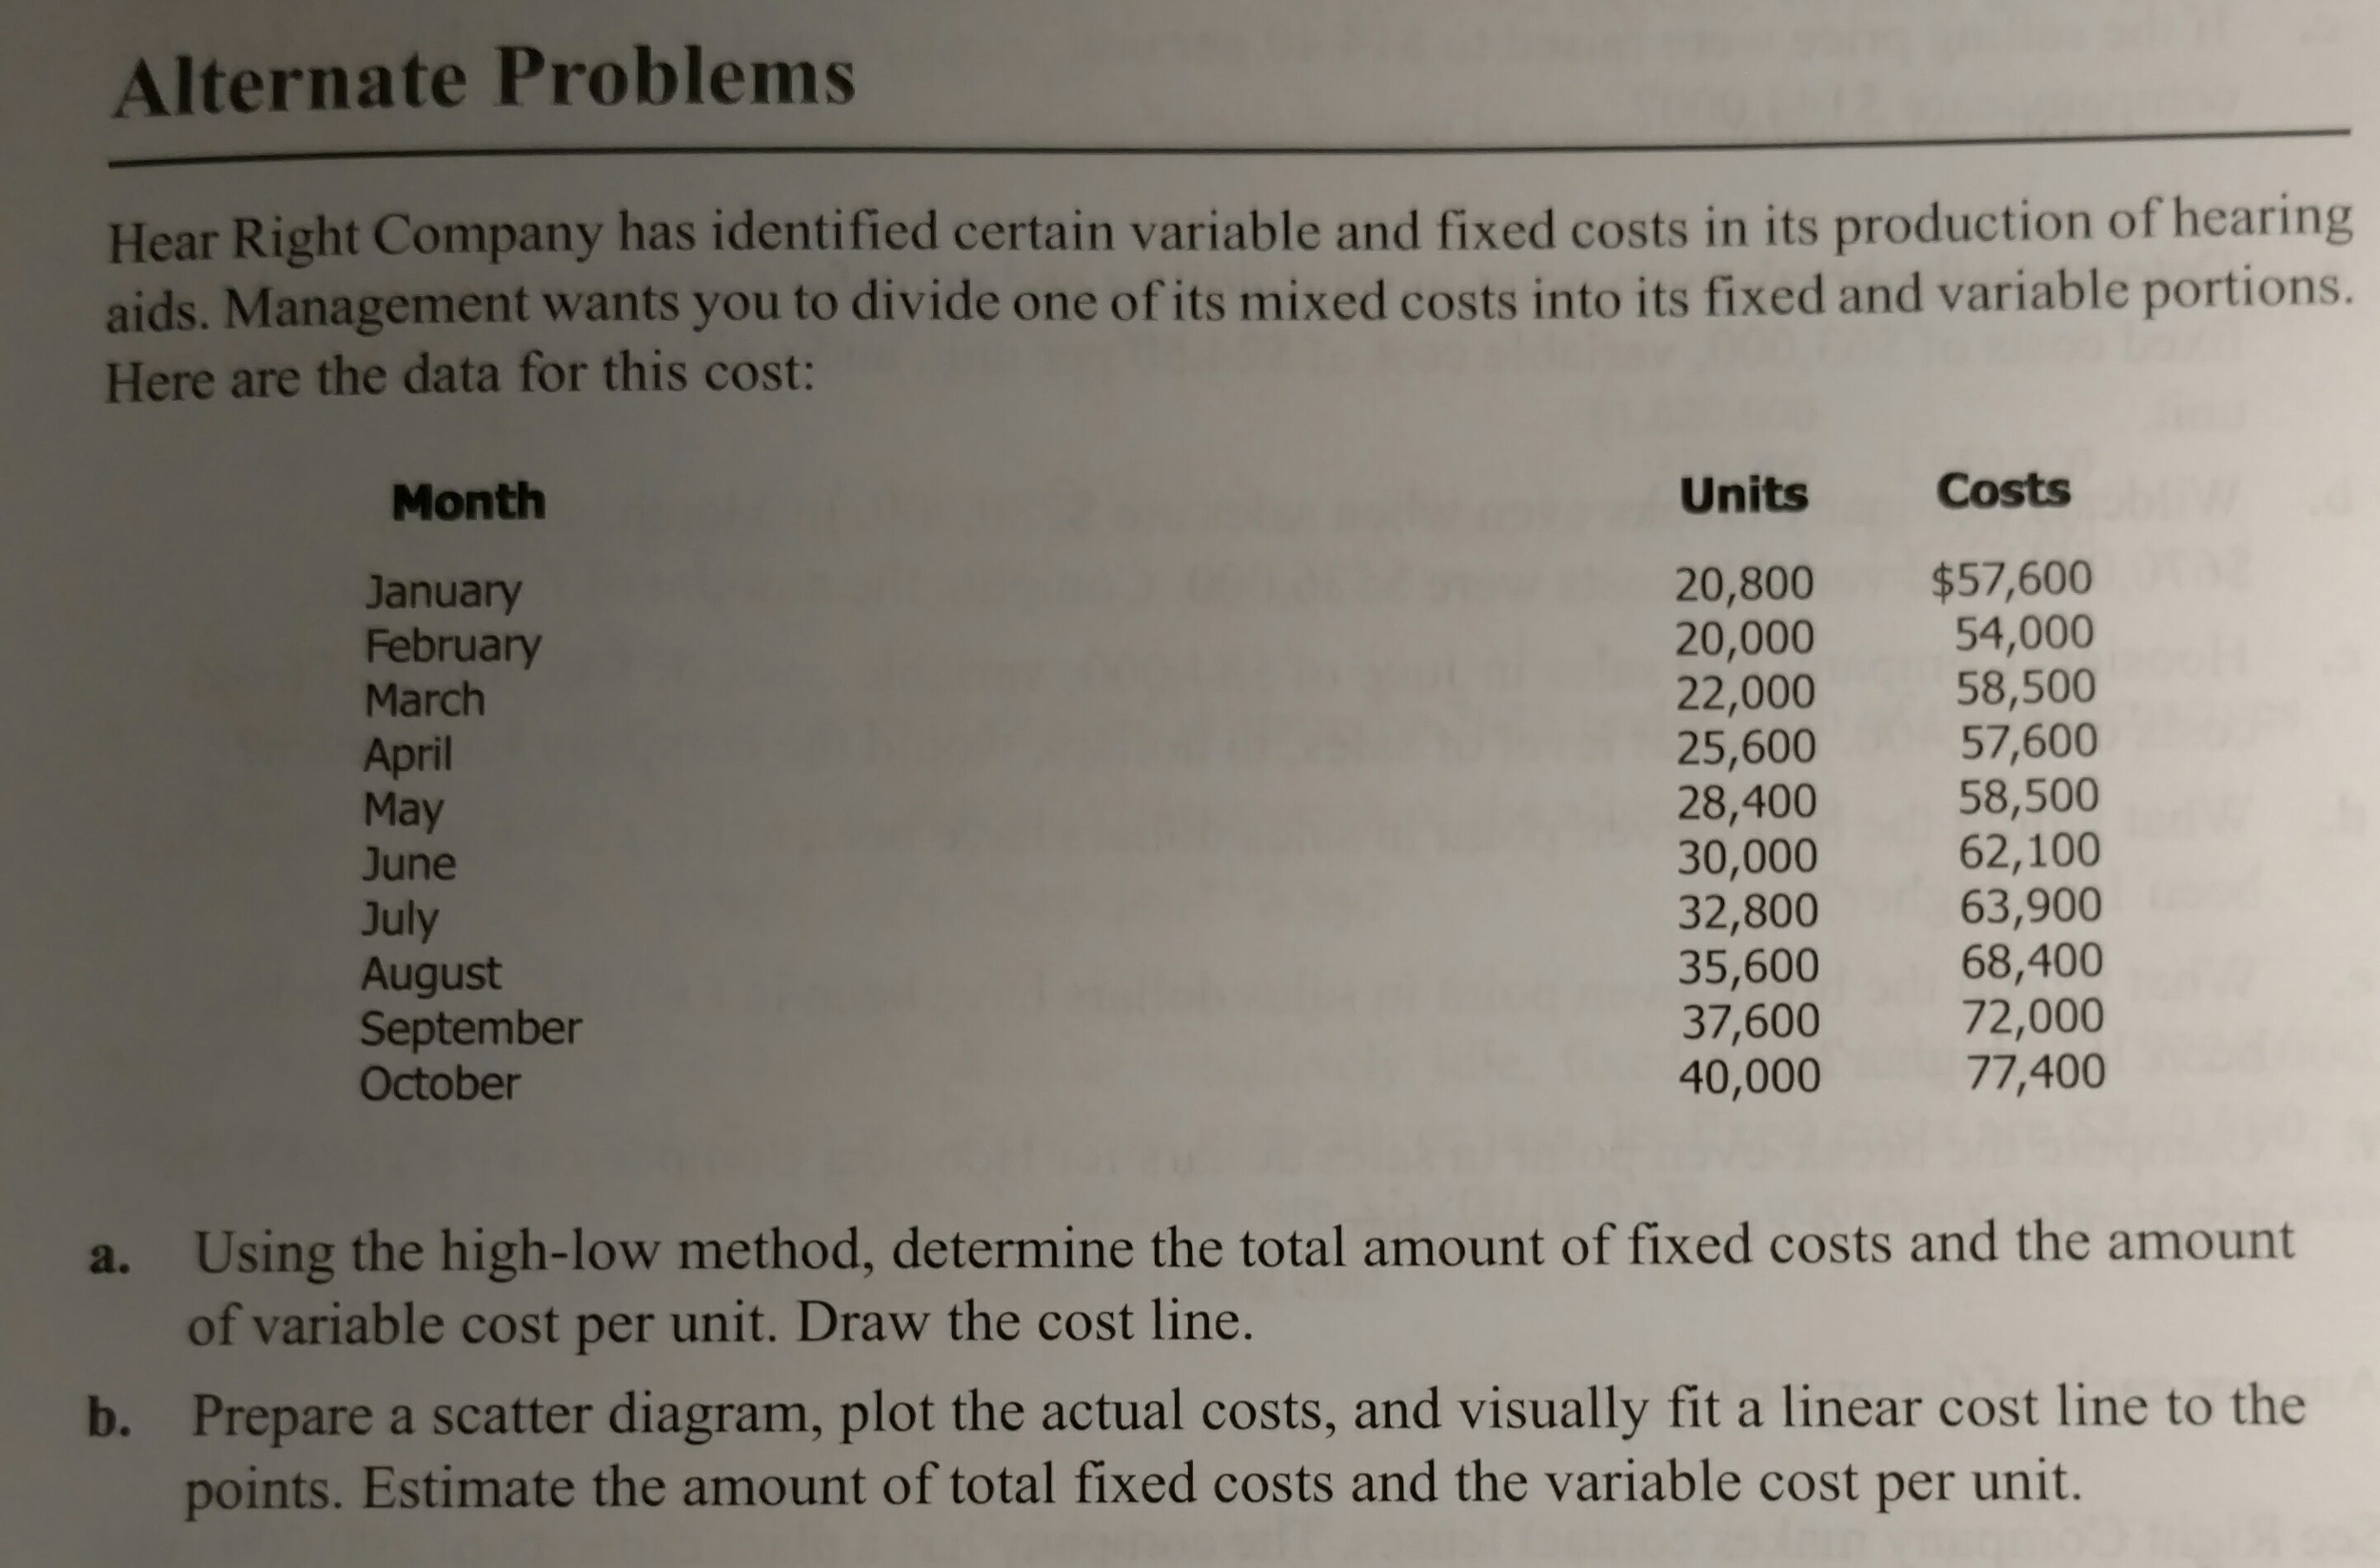
Question
Prepare a scatter diagram, plot the acutal costs, and visually fit a linear cost line to the points. estiamte the amount of total fixed costs


Prepare a scatter diagram, plot the acutal costs, and visually fit a linear cost line to the points. estiamte the amount of total fixed costs and the variable cost per unit.
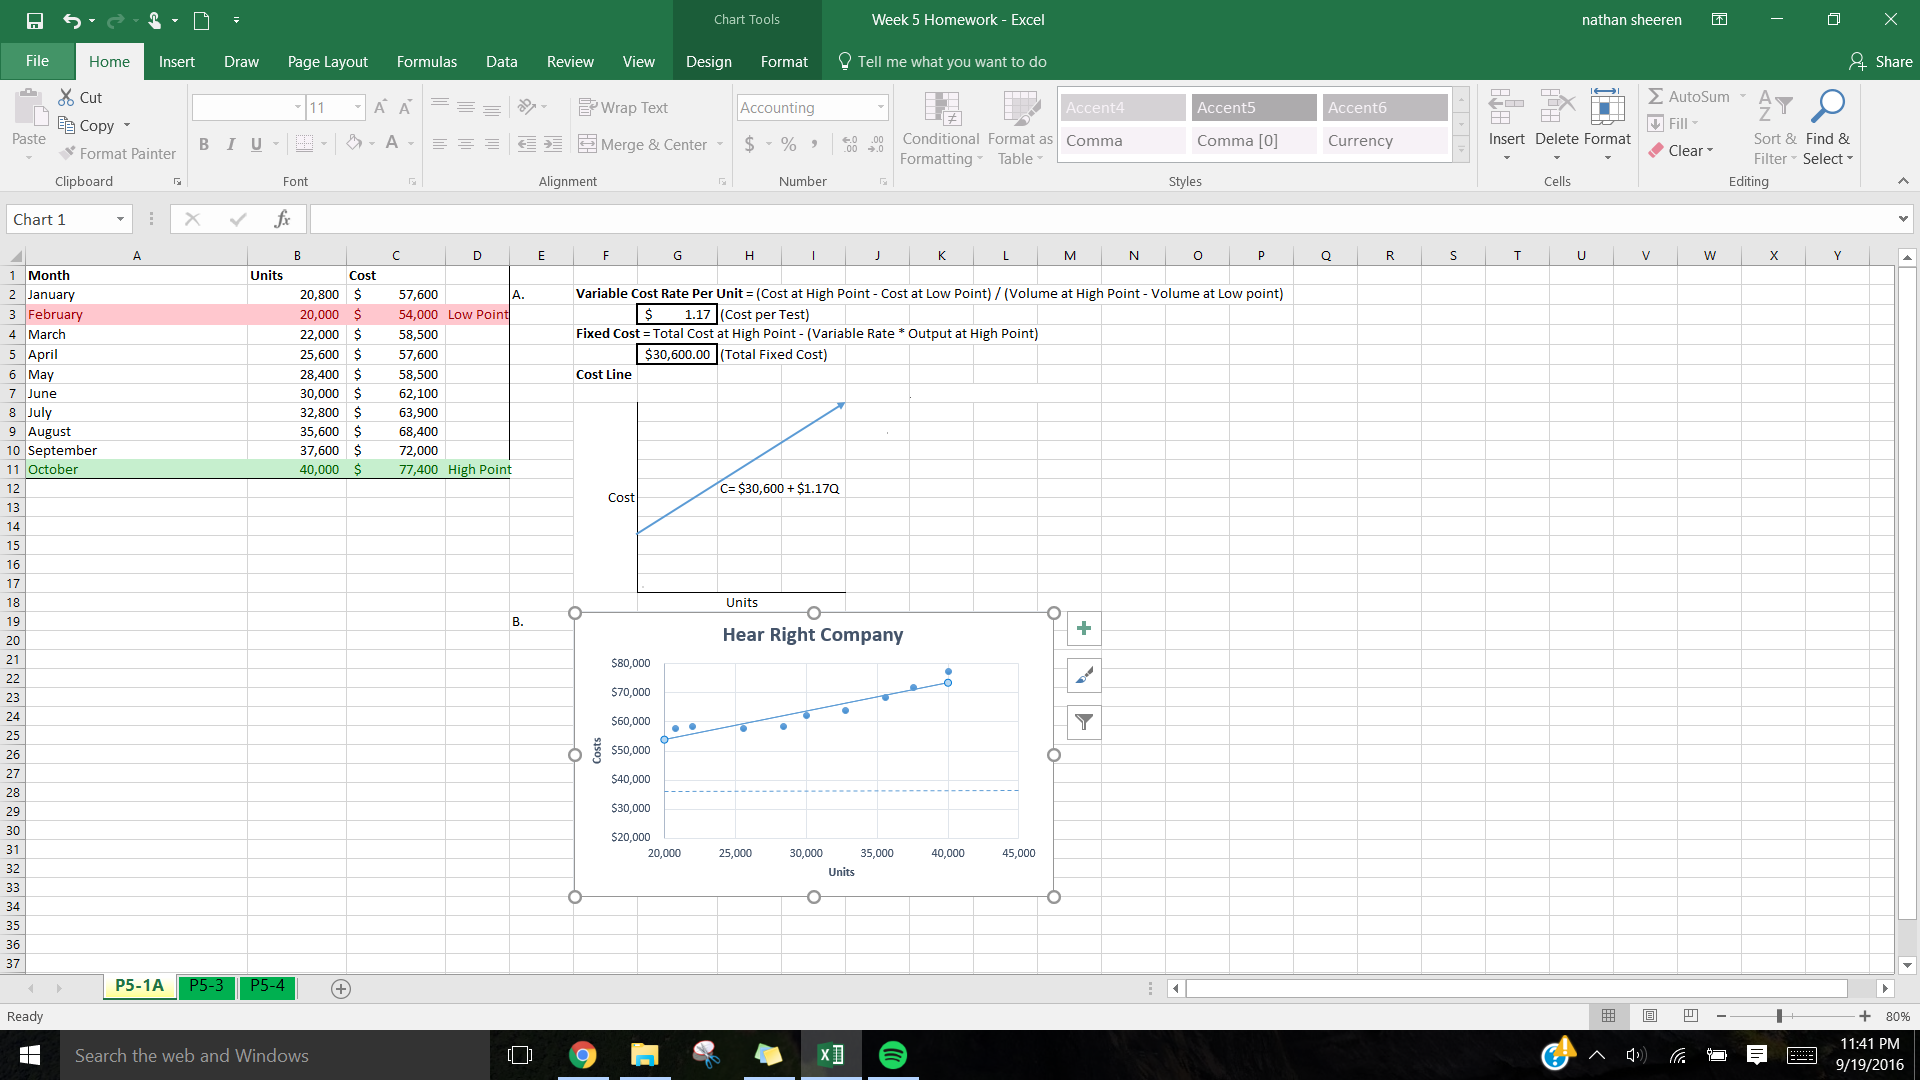
I have included my attempt at this scatter plot. I do not know what to do with the variable cost per unit. I need to see the answere in its completed form if possible. Its the entire graph that confuses me for the most part.
For the Variable cost per unit i did: Y2-Y1 / X2-X1 (57600 - 54000 / 20800 - 20000) = 4.5 But im not sure what to do with this, if anything.
For the Fixed costs, i just put a horizontal line on $36,000... again i have no idea what to actually do with this section either.
Step by Step Solution
There are 3 Steps involved in it
Step: 1

Get Instant Access to Expert-Tailored Solutions
See step-by-step solutions with expert insights and AI powered tools for academic success
Step: 2

Step: 3

Ace Your Homework with AI
Get the answers you need in no time with our AI-driven, step-by-step assistance
Get Started


