Prepare a value stream statement
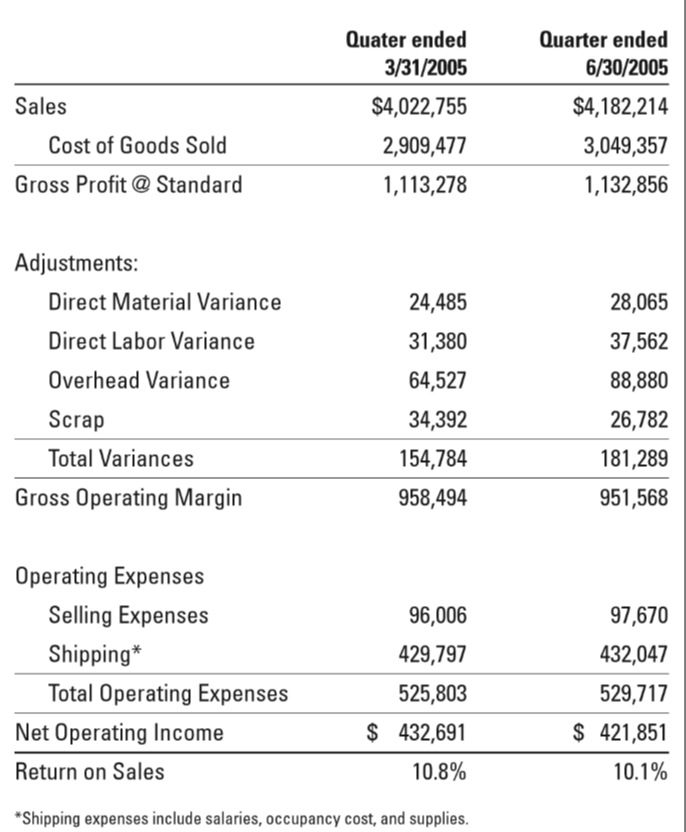
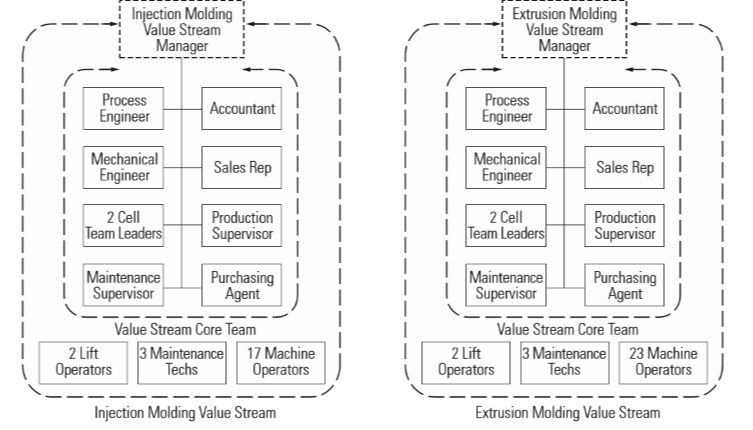
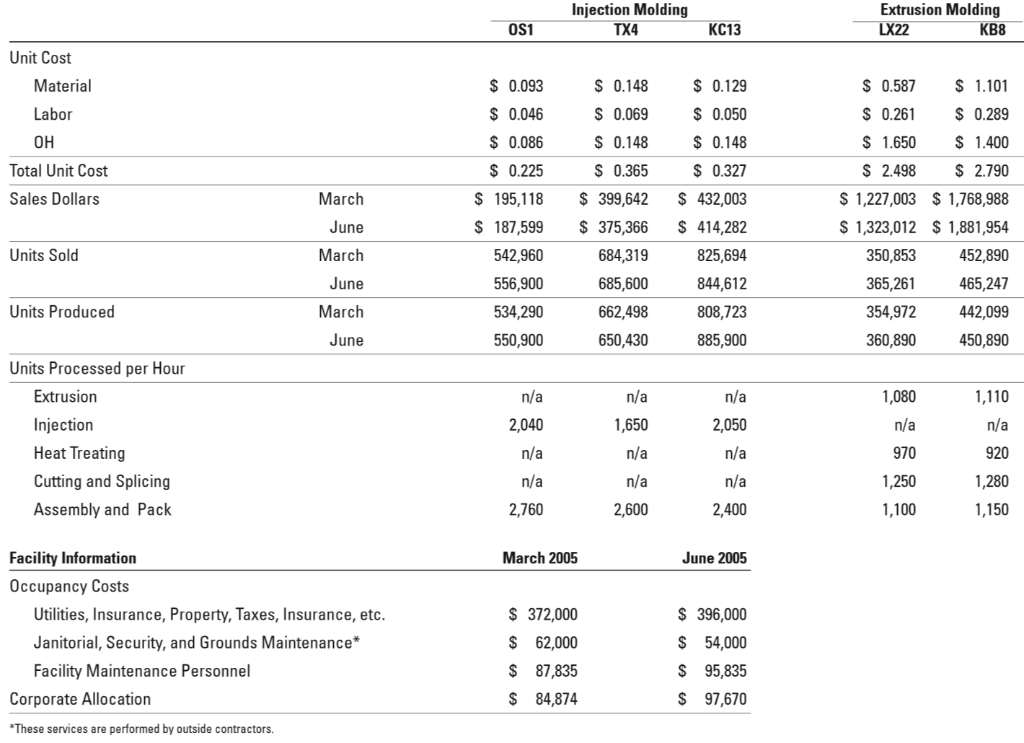
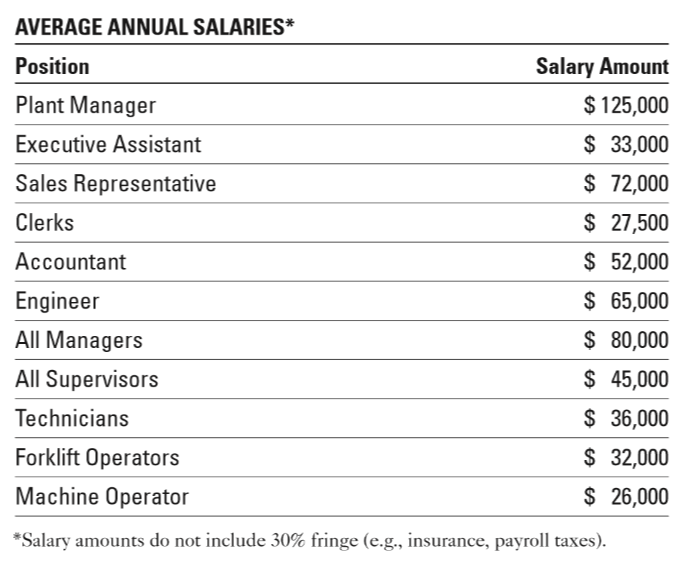
Quater ended 3/31/2005 Quarter ended 6/30/2005 Sales Cost of Goods Sold Gross Profit @ Standard $4,022,755 2,909,477 1,113,278 $4,182,214 3,049,357 1,132,856 Adjustments: Direct Material Variance Direct Labor Variance 24,485 28,065 31,380 37,562 Overhead Variance 64,527 Scrap Total Variances Gross Operating Margin 34,392 154,784 958,494 88,880 26,782 181,289 951,568 96,006 97,670 429,797 Operating Expenses Selling Expenses Shipping* Total Operating Expenses Net Operating Income Return on Sales 525,803 $ 432,691 432,047 529,717 $ 421,851 10.1% 10.8% *Shipping expenses include salaries, occupancy cost, and supplies. Injection Molding Value Stream Manager Extrusion Molding Value Stream Manager Process Engineer Accountant Process Engineer Accountant Mechanical Engineer Sales Rep 1 1 I 1 Mechanical Engineer Sales Rep 2 Cell Team Leaders Production Supervisor 2 Cell Team Leaders Production Supervisor 1 Maintenance Supervisor Purchasing Agent Maintenance Supervisor Purchasing Agent Value Stream Core Team 2 Lift 3 Maintenance 17 Machine Operators Techs Operators Value Stream Core Team 2 Lift 3 Maintenance 23 Machine Operators Techs Operators Injection Molding Value Stream Extrusion Molding Value Stream Injection Molding TX4 Extrusion Molding LX22 KB8 OS1 KC13 Unit Cost Material $ 0.093 $ 0.148 $ 0.129 $ 0.587 $ 1.101 Labor $ 0.069 $ 0.050 $ 0.289 $ 0.046 $ 0.086 $ 0.261 $ 1.650 OH $ 0.148 $ 0.148 $ 1.400 Total Unit Cost $ 0.225 $ 0.365 Sales Dollars $ 399,642 March June Units Sold March June $ 195,118 $ 187,599 542,960 556,900 534,290 550,900 $ 375,366 684,319 685,600 662,498 650,430 $ 0.327 $ 432,003 $ 414,282 825,694 844,612 808,723 885,900 $ 2.498 $ 2.790 $ 1,227,003 $ 1,768,988 $ 1,323,012 $ 1,881,954 350,853 452,890 365,261 465,247 354,972 442,099 360,890 450,890 Units Produced March June n/a n/a n/a 1,080 1,110 2,040 1,650 2,050 n/a n/a Units Processed per Hour Extrusion Injection Heat Treating Cutting and Splicing Assembly and Pack n/a n/a n/a 970 920 n/a n/a n/a 1,250 1,280 1,150 2,760 2,600 2,400 1,100 March 2005 June 2005 Facility Information Occupancy Costs Utilities, Insurance, Property, Taxes, Insurance, etc. Janitorial, Security, and Grounds Maintenance* Facility Maintenance Personnel Corporate Allocation $ 372,000 $ 62,000 $ 87,835 $ 84,874 $ 396,000 $ 54,000 $ 95,835 $ 97,670 *These services are performed by outside contractors. AVERAGE ANNUAL SALARIES* Position Plant Manager Executive Assistant Sales Representative Clerks Salary Amount $ 125,000 $ 33,000 $ 72,000 $ 27,500 $ 52,000 $ 65,000 Accountant Engineer All Managers All Supervisors Technicians Forklift Operators Machine Operator $ 80,000 $ 45,000 $ 36,000 $ 32,000 $ 26,000 *Salary amounts do not include 30% fringe (e.g., insurance, payroll taxes). Quater ended 3/31/2005 Quarter ended 6/30/2005 Sales Cost of Goods Sold Gross Profit @ Standard $4,022,755 2,909,477 1,113,278 $4,182,214 3,049,357 1,132,856 Adjustments: Direct Material Variance Direct Labor Variance 24,485 28,065 31,380 37,562 Overhead Variance 64,527 Scrap Total Variances Gross Operating Margin 34,392 154,784 958,494 88,880 26,782 181,289 951,568 96,006 97,670 429,797 Operating Expenses Selling Expenses Shipping* Total Operating Expenses Net Operating Income Return on Sales 525,803 $ 432,691 432,047 529,717 $ 421,851 10.1% 10.8% *Shipping expenses include salaries, occupancy cost, and supplies. Injection Molding Value Stream Manager Extrusion Molding Value Stream Manager Process Engineer Accountant Process Engineer Accountant Mechanical Engineer Sales Rep 1 1 I 1 Mechanical Engineer Sales Rep 2 Cell Team Leaders Production Supervisor 2 Cell Team Leaders Production Supervisor 1 Maintenance Supervisor Purchasing Agent Maintenance Supervisor Purchasing Agent Value Stream Core Team 2 Lift 3 Maintenance 17 Machine Operators Techs Operators Value Stream Core Team 2 Lift 3 Maintenance 23 Machine Operators Techs Operators Injection Molding Value Stream Extrusion Molding Value Stream Injection Molding TX4 Extrusion Molding LX22 KB8 OS1 KC13 Unit Cost Material $ 0.093 $ 0.148 $ 0.129 $ 0.587 $ 1.101 Labor $ 0.069 $ 0.050 $ 0.289 $ 0.046 $ 0.086 $ 0.261 $ 1.650 OH $ 0.148 $ 0.148 $ 1.400 Total Unit Cost $ 0.225 $ 0.365 Sales Dollars $ 399,642 March June Units Sold March June $ 195,118 $ 187,599 542,960 556,900 534,290 550,900 $ 375,366 684,319 685,600 662,498 650,430 $ 0.327 $ 432,003 $ 414,282 825,694 844,612 808,723 885,900 $ 2.498 $ 2.790 $ 1,227,003 $ 1,768,988 $ 1,323,012 $ 1,881,954 350,853 452,890 365,261 465,247 354,972 442,099 360,890 450,890 Units Produced March June n/a n/a n/a 1,080 1,110 2,040 1,650 2,050 n/a n/a Units Processed per Hour Extrusion Injection Heat Treating Cutting and Splicing Assembly and Pack n/a n/a n/a 970 920 n/a n/a n/a 1,250 1,280 1,150 2,760 2,600 2,400 1,100 March 2005 June 2005 Facility Information Occupancy Costs Utilities, Insurance, Property, Taxes, Insurance, etc. Janitorial, Security, and Grounds Maintenance* Facility Maintenance Personnel Corporate Allocation $ 372,000 $ 62,000 $ 87,835 $ 84,874 $ 396,000 $ 54,000 $ 95,835 $ 97,670 *These services are performed by outside contractors. AVERAGE ANNUAL SALARIES* Position Plant Manager Executive Assistant Sales Representative Clerks Salary Amount $ 125,000 $ 33,000 $ 72,000 $ 27,500 $ 52,000 $ 65,000 Accountant Engineer All Managers All Supervisors Technicians Forklift Operators Machine Operator $ 80,000 $ 45,000 $ 36,000 $ 32,000 $ 26,000 *Salary amounts do not include 30% fringe (e.g., insurance, payroll taxes)


