Prepare Financial Forecast Using eVal Model For Hasbro
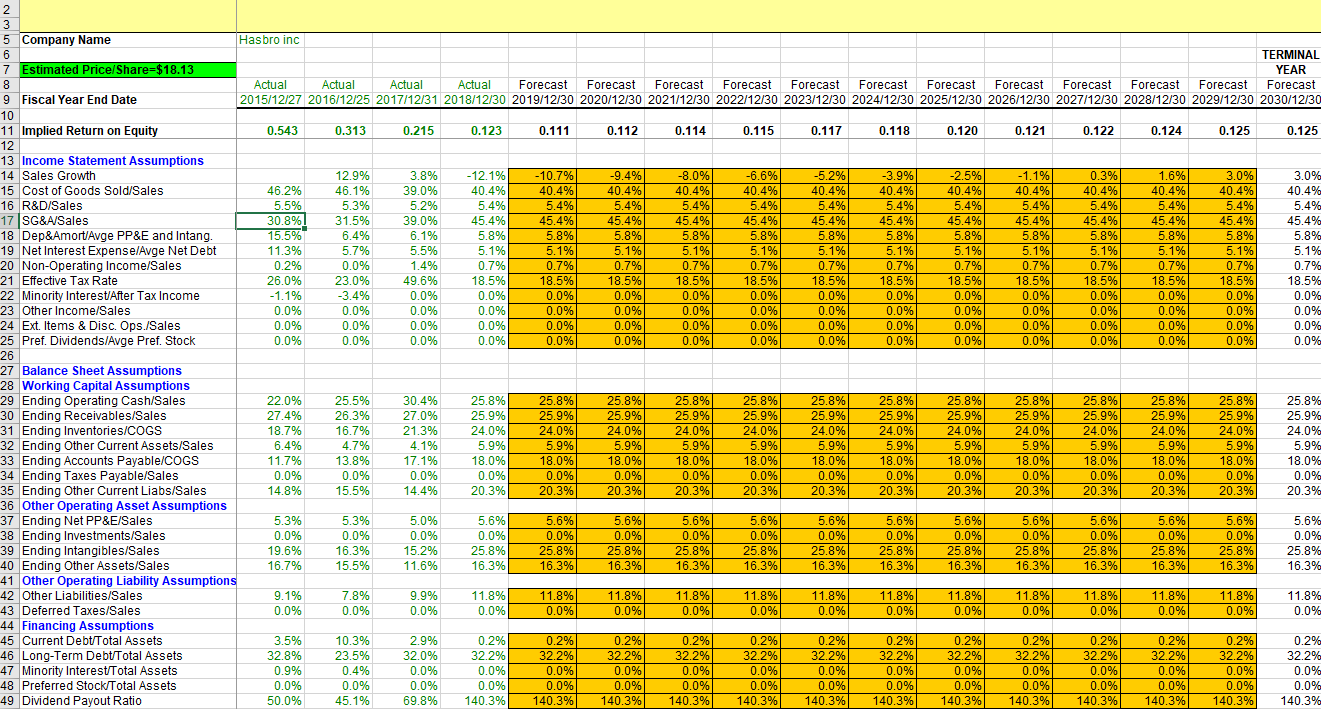
open eVal model and go to the Forecasting Assumptions worksheet. You will see 5 years of historical data on each of forecasting assumptions lines and 11 years of forecast data in shaded cells. The model calculated 5 years of historical data based on the companys information you entered while completing part #1. Fill in the shaded cells of forecast assumptions.
1.Explanation of Growth Rates
2. Explanation of All Other Assumptions
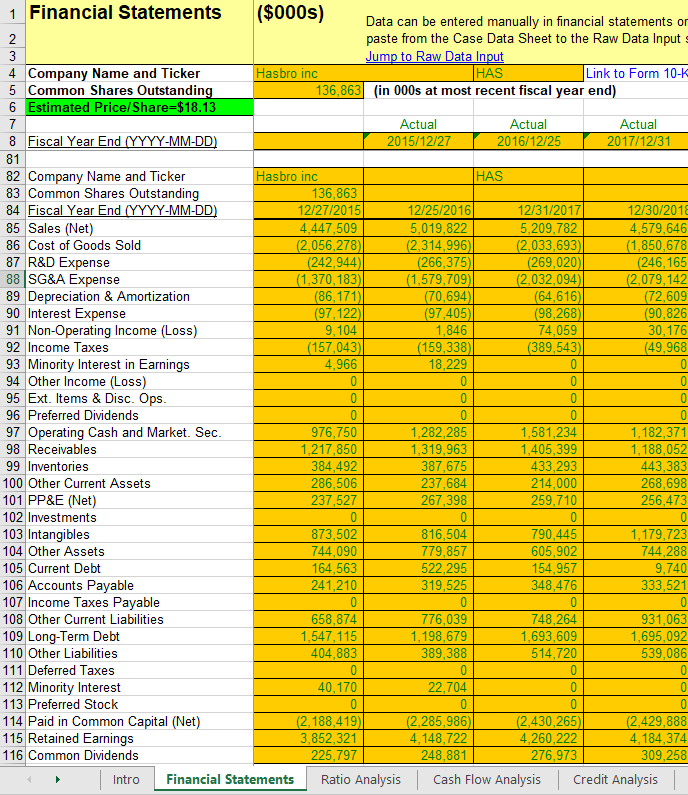
3. Explanation and Interpretation of Projected Financial Statements.
4. Explanation an Interpretation of Overall Forecast Results & Financial Ratios
2 3 5 Company Name Hasbro inc 6 TERMINAL 7 Estimated Price/Share=$18.13 YEAR 8 Actual Actual Actual Actual Forecast Forecast Forecast Forecast Forecast Forecast Forecast Forecast Forecast Forecast Forecast Forecast 9 Fiscal Year End Date 2015/12/27 2016/12/25 2017/12/31 2018/12/30 2019/12/30 2020/12/30 2021/12/30 2022/12/30 2023/12/30 2024/12/30 2025/12/30 2026/12/30 2027/12/30 2028/12/30 2029/12/30 2030/12/30 10 11 Implied Return on Equity 0.543 0.313 0.215 0.123 0.111 0.112 0.114 0.115 0.117 0.118 0.120 0.121 0.122 0.124 0.125 0.125 12 13 Income Statement Assumptions 14 Sales Growth 12.9% 3.8% - 12.1% -10.7% -9.4% -8.0% -6.6% -5.2% -3.9% -2.5% -1.1% 0.3% % 1.6% 3.0% 3.0% 15 Cost of Goods Sold/Sales 46.2% 46.1% 39.0% 40.4% 40.4% 40.4% 40.4% 40.4% 40.4% 40.4% 40.4% 40.4% 40.4% 40.4% 40.4% 40.4% 16 R&D/Sales 5.5% 5.3% 5.2% 5.4% 5.4% 5.4% 5.4% 5.4% 5.4% 5.4% 5.4% 5.4% 5.4% 5.4% 5.4% 5.4% 17 SG&A/Sales 30.8% 31.5% 39.0% 45.4% 45.4% 45.4% 45.4% 45.4% 45.4% 45.4% 45.4% 45.4% 45.4% 45.4% 45.4% 45.4% 18 Dep&Amort/Avge PP&E and Intang. 15.5% 6.4% 6.1% 5.8% 5.8% 5.8% 5.8% 5.8% 5.8% % 5.8% 5.8% 5.8% 5.8% 5.8% 5.8% 5.8% 19 Net Interest Expense/Avge Net Debt 11.3% 5.7% 5.5% 5.1% 5.1% 5.1% 5.1% 5.1% 5.1% 5.1% 5.1% 5.1% 5.1% 5.1% 5.1% 5.1% 20 Non-Operating Income/Sales 0.2% 0.0% 1.4% 0.7% 0.7% 0.7% 0.7% 0.7% 0.7% 0.7% 0.7% 0.7% 0.7% 0.7% 0.7% 0.7% 21 Effective Tax Rate 26.0% 23.0% 49.6% 18.5% 18.5% 18.5% 18.5% 18.5% 18.5% 18.5% 18.5% 18.5% 18.5% 18.5% 18.5% 18.5% 22 Minority Interest/After Tax Income -1.1% -3.4% 0.0% 0.0% 0.0% 0.0% 0.0% 0.0% 0.0% 0.0% 0.0% % 0.0% 0.0% 0.0% 0.0% 0.0% 23 Other Income/Sales 0.0% 0.0% 0.0% 0.0% 0.0% 0.0% 0.0% 0.0% 0.0% 0.0% 0.0% 0.0% 0.0% 0.0% 0.0% 0.0% 24 Ext. Items & Disc. Ops./Sales 0.0% 0.0% 0.0% 0.0% 0.0% 0.0% 0.0% 0.0% 0.0% 0.0% 0.0% 0.0% 0.0% 0.0% 0.0% 0.0% 25 Pref. Dividends/Avge Pref. Stock 0.0% 0.0% 0.0% 0.0% 0.0% 0.0% 0.0% 0.0% 0.0% 0.0% 0.0% 0.0% 0.0% 0.0% 0.0% 0.0% 26 27 Balance Sheet Assumptions 28 Working Capital Assumptions 29 Ending Operating Cash/Sales 22.0% 25.5% 30.4% 25.8% 25.8% 25.8% 25.8% 25.8% 25.8% 25.8% 25.8% 25.8% 25.8% 25.8% 25.8% 25.8% 30 Ending Receivables/Sales 27.4% 26.3% 27.0% % 25.9% 25.9% 25.9% 25.9% 25.9% 25.9% 25.9% 25.9% 25.9% 25.9% 25.9% 25.9%) 25.9% 31 Ending Inventories/COGS 18.7% 16.7% 21.3% 24.0% 24.0% 24.0% 24.0% 24.0% 24.0% 24.0% 24.0% 24.0% 24.0% 24.0% 24.0% 24.0% 32 Ending Other Current Assets/Sales 6.4% 4.7% 4.1% 5.9% 5.9% 5.9% 5.9% 5.9% 5.9% 5.9% 5.9% 5.9% 5.9% 5.9% 5.9% 5.9% 33 Ending Accounts Payable/COGS 11.7% 13.8% 17.1% 18.0% 18.0% 18.0% 18.0% 18.0% 18.0% 18.0% 18.0% 18.0% 18.0% 18.0% 18.0% 18.0% 34 Ending Taxes Payable/Sales 0.0% 0.0% 0.0% 0.0% 0.0% 0.0% 0.0% 0.0% 0.0% 0.0% 0.0% 0.0% 0.0% 0.0% 0.0% 0.0% 35 Ending Other Current Liabs/Sales 14.8% 15.5% 14.4% 20.3% 20.3% 20.3% 20.3% 20.3% 20.3% 20.3% 20.3% 20.3% 20.3% 20.3% 20.3% 20.3% 36 Other Operating Asset Assumptions 37 Ending Net PP&E/Sales 5.3% 5.3% 5.0% 5.6% 5.6% 5.6% 5.6% 5.6% 5.6% 5.6% 5.6% 5.6% 5.6% 5.6% 5.6% 5.6% 38 Ending Investments/Sales 0.0% 0.0% 0.0% 0.0% 0.0% 0.0% 0.0% 0.0% 0.0% 0.0% 0.0% 0.0% 0.0% 0.0% 0.0% 0.0% % 39 Ending Intangibles/Sales 19.6% 16.3% 15.2% 25.8% 25.8% 25.8% 25.8% 25.8% 25.8% 25.8% 25.8% 25.8% 25.8% 25.8% 25.8% 25.8% 40 Ending Other Assets/Sales 16.7% 15.5% 11.6% 16.3% % 16.3% 16.3% % 16.3% 16.3% 16.3% 16.3% 16.3% 16.3% 16.3% % 16.3% 16.3% 16.3% 41 Other Operating Liability Assumptions 42 Other Liabilities/Sales 9.1% 7.8% 9.9% 11.8% 11.8% 11.8% 11.8% 11.8% 11.8% 11.8% 11.8% 11.8% 11.8% 11.8% 11.8% % 11.8% % 43 Deferred Taxes/Sales 0.0% 0.0% 0.0% 0.0% 0.0% 0.0% 0.0% 0.0% % 0.0% 0.0% 0.0% 0.0% 0.0% 0.0% 0.0% 0.0% 44 Financing Assumptions 45 Current Debt Total Assets 3.5% 10.3% 2.9% 0.2% 0.2% 0.2% 0.2% 0.2% 0.2% 0.2% 0.2% 0.2% 0.2% 0.2% 0.2% 0.2% 46 Long-Term Debt Total Assets 32.8% 23.5% 32.0% 32.2% 32.2% 32.2% 32.2% 32.2% 32.2% 32.2% 32.2% 32.2% 32.2% 32.2% 32.2% 32.2% 47 Minority Interest/Total Assets 0.9% 0.4% 0.0% 0.0% 0.0% 0.0% 0.0% 0.0% 0.0% 0.0% 0.0% 0.0% 0.0% 0.0% 0.0% % 0.0% 48 Preferred Stock/Total Assets 0.0% 0.0% 0.0% 0.0% 0.0% 0.0% 0.0% 0.0% 0.0% 0.0% 0.0% 0.0% 0.0% % 0.0% 0.0% 0.0% 49 Dividend Payout Ratio 50.0% 45.1% 69.8% 140.3% 140.3% 140.3% 140.3% 140.3% 140.3% 140.3% 140.3% 140.3% 140.3% 140.3% 140.3% 140.3% 1 Financial Statements ($000s) Data can be entered manually in financial statements or 2 paste from the Case Data Sheet to the Raw Data Input 3 Jump to Raw Data Input 4 Company Name and Ticker Hasbro inc HAS Link to Form 10-K 5 Common Shares Outstanding 136,863 (in 000s at most recent fiscal year end) 6 Estimated Price/Share=$18.13 7 Actual Actual Actual 8 Fiscal Year End (YYYY-MM-DD) 2015/12/27 2016/12/25 2017/12/31 81 82 Company Name and Ticker Hasbro inc HAS 83 Common Shares Outstanding 136,863 84 Fiscal Year End (YYYY-MM-DD 12/27/2015 12/25/2016 12/31/2017 12/30/2018 85 Sales (Net) 4,447,509 5,019,822 5,209,782 4,579,646 86 Cost of Goods Sold (2,056,278) (2,314,996 (2,033,693) (1,850,678 87 R&D Expense (242,944) (266,375) (269,020) (246,165 88 SG&A Expense (1,370,183) (1,579,709) (2,032,094) (2,079,142 89 Depreciation & Amortization (86,171) (70,694) (64,616) (72,609 90 Interest Expense (97,122) (97,405) (98,268) (90,826 91 Non-Operating Income (Loss) 9,104 1,846 74,059 30,176 92 Income Taxes (157,043) (159,338) (389,543) (49.968 93 Minority Interest in Earnings 4,966 18,229 0 0 94 Other Income (Loss) 0 0 0 0 95 Ext. Items & Disc. Ops. 0 0 0 0 96 Preferred Dividends 0 0 0 0 97 Operating Cash and Market. Sec. 976,750 1,282,285 1,581,234 1,182,371 98 Receivables 1,217,850 1,319,963 1,405,399 1,188,052 99 Inventories 384,492 387,675 433,293 443,383 100 Other Current Assets 286,506 237,684 214,000 268,698 101 PP&E (Net) 237,527 267,398 259,710 256,473 102 Investments 0 0 0 0 103 Intangibles 873,502 816,504 790,445 1,179,723 104 Other Assets 744,090 779,857 605,902 744,288 105 Current Debt 164,563 522,295 154,957 9,740 106 Accounts Payable 241,210 319,525 348,476 333,521 107 Income Taxes Payable 0 0 0 0 108 Other Current Liabilities 658,874 776,039 748,264 931,063 109 Long-Term Debt 1,547,115 1,198,679 1,693,609 1,695,092 110 Other Liabilities 404,883 389,388 514,720 539,086 111 Deferred Taxes 0 0 112 Minority Interest 40,170 22,704 0 0 113 Preferred Stock 0 0 0 0 114 Paid in Common Capital (Net) (2,188,419) (2.285,986 (2,430,265) (2.429,888 115 Retained Earnings 3,852,321 4,148,722 4,260,222 4,184,374 116 Common Dividends 225,797 248,881 276,973 309,258 Intro Financial Statements Ratio Analysis | Cash Flow Analysis Credit Analysis 2 3 5 Company Name Hasbro inc 6 TERMINAL 7 Estimated Price/Share=$18.13 YEAR 8 Actual Actual Actual Actual Forecast Forecast Forecast Forecast Forecast Forecast Forecast Forecast Forecast Forecast Forecast Forecast 9 Fiscal Year End Date 2015/12/27 2016/12/25 2017/12/31 2018/12/30 2019/12/30 2020/12/30 2021/12/30 2022/12/30 2023/12/30 2024/12/30 2025/12/30 2026/12/30 2027/12/30 2028/12/30 2029/12/30 2030/12/30 10 11 Implied Return on Equity 0.543 0.313 0.215 0.123 0.111 0.112 0.114 0.115 0.117 0.118 0.120 0.121 0.122 0.124 0.125 0.125 12 13 Income Statement Assumptions 14 Sales Growth 12.9% 3.8% - 12.1% -10.7% -9.4% -8.0% -6.6% -5.2% -3.9% -2.5% -1.1% 0.3% % 1.6% 3.0% 3.0% 15 Cost of Goods Sold/Sales 46.2% 46.1% 39.0% 40.4% 40.4% 40.4% 40.4% 40.4% 40.4% 40.4% 40.4% 40.4% 40.4% 40.4% 40.4% 40.4% 16 R&D/Sales 5.5% 5.3% 5.2% 5.4% 5.4% 5.4% 5.4% 5.4% 5.4% 5.4% 5.4% 5.4% 5.4% 5.4% 5.4% 5.4% 17 SG&A/Sales 30.8% 31.5% 39.0% 45.4% 45.4% 45.4% 45.4% 45.4% 45.4% 45.4% 45.4% 45.4% 45.4% 45.4% 45.4% 45.4% 18 Dep&Amort/Avge PP&E and Intang. 15.5% 6.4% 6.1% 5.8% 5.8% 5.8% 5.8% 5.8% 5.8% % 5.8% 5.8% 5.8% 5.8% 5.8% 5.8% 5.8% 19 Net Interest Expense/Avge Net Debt 11.3% 5.7% 5.5% 5.1% 5.1% 5.1% 5.1% 5.1% 5.1% 5.1% 5.1% 5.1% 5.1% 5.1% 5.1% 5.1% 20 Non-Operating Income/Sales 0.2% 0.0% 1.4% 0.7% 0.7% 0.7% 0.7% 0.7% 0.7% 0.7% 0.7% 0.7% 0.7% 0.7% 0.7% 0.7% 21 Effective Tax Rate 26.0% 23.0% 49.6% 18.5% 18.5% 18.5% 18.5% 18.5% 18.5% 18.5% 18.5% 18.5% 18.5% 18.5% 18.5% 18.5% 22 Minority Interest/After Tax Income -1.1% -3.4% 0.0% 0.0% 0.0% 0.0% 0.0% 0.0% 0.0% 0.0% 0.0% % 0.0% 0.0% 0.0% 0.0% 0.0% 23 Other Income/Sales 0.0% 0.0% 0.0% 0.0% 0.0% 0.0% 0.0% 0.0% 0.0% 0.0% 0.0% 0.0% 0.0% 0.0% 0.0% 0.0% 24 Ext. Items & Disc. Ops./Sales 0.0% 0.0% 0.0% 0.0% 0.0% 0.0% 0.0% 0.0% 0.0% 0.0% 0.0% 0.0% 0.0% 0.0% 0.0% 0.0% 25 Pref. Dividends/Avge Pref. Stock 0.0% 0.0% 0.0% 0.0% 0.0% 0.0% 0.0% 0.0% 0.0% 0.0% 0.0% 0.0% 0.0% 0.0% 0.0% 0.0% 26 27 Balance Sheet Assumptions 28 Working Capital Assumptions 29 Ending Operating Cash/Sales 22.0% 25.5% 30.4% 25.8% 25.8% 25.8% 25.8% 25.8% 25.8% 25.8% 25.8% 25.8% 25.8% 25.8% 25.8% 25.8% 30 Ending Receivables/Sales 27.4% 26.3% 27.0% % 25.9% 25.9% 25.9% 25.9% 25.9% 25.9% 25.9% 25.9% 25.9% 25.9% 25.9% 25.9%) 25.9% 31 Ending Inventories/COGS 18.7% 16.7% 21.3% 24.0% 24.0% 24.0% 24.0% 24.0% 24.0% 24.0% 24.0% 24.0% 24.0% 24.0% 24.0% 24.0% 32 Ending Other Current Assets/Sales 6.4% 4.7% 4.1% 5.9% 5.9% 5.9% 5.9% 5.9% 5.9% 5.9% 5.9% 5.9% 5.9% 5.9% 5.9% 5.9% 33 Ending Accounts Payable/COGS 11.7% 13.8% 17.1% 18.0% 18.0% 18.0% 18.0% 18.0% 18.0% 18.0% 18.0% 18.0% 18.0% 18.0% 18.0% 18.0% 34 Ending Taxes Payable/Sales 0.0% 0.0% 0.0% 0.0% 0.0% 0.0% 0.0% 0.0% 0.0% 0.0% 0.0% 0.0% 0.0% 0.0% 0.0% 0.0% 35 Ending Other Current Liabs/Sales 14.8% 15.5% 14.4% 20.3% 20.3% 20.3% 20.3% 20.3% 20.3% 20.3% 20.3% 20.3% 20.3% 20.3% 20.3% 20.3% 36 Other Operating Asset Assumptions 37 Ending Net PP&E/Sales 5.3% 5.3% 5.0% 5.6% 5.6% 5.6% 5.6% 5.6% 5.6% 5.6% 5.6% 5.6% 5.6% 5.6% 5.6% 5.6% 38 Ending Investments/Sales 0.0% 0.0% 0.0% 0.0% 0.0% 0.0% 0.0% 0.0% 0.0% 0.0% 0.0% 0.0% 0.0% 0.0% 0.0% 0.0% % 39 Ending Intangibles/Sales 19.6% 16.3% 15.2% 25.8% 25.8% 25.8% 25.8% 25.8% 25.8% 25.8% 25.8% 25.8% 25.8% 25.8% 25.8% 25.8% 40 Ending Other Assets/Sales 16.7% 15.5% 11.6% 16.3% % 16.3% 16.3% % 16.3% 16.3% 16.3% 16.3% 16.3% 16.3% 16.3% % 16.3% 16.3% 16.3% 41 Other Operating Liability Assumptions 42 Other Liabilities/Sales 9.1% 7.8% 9.9% 11.8% 11.8% 11.8% 11.8% 11.8% 11.8% 11.8% 11.8% 11.8% 11.8% 11.8% 11.8% % 11.8% % 43 Deferred Taxes/Sales 0.0% 0.0% 0.0% 0.0% 0.0% 0.0% 0.0% 0.0% % 0.0% 0.0% 0.0% 0.0% 0.0% 0.0% 0.0% 0.0% 44 Financing Assumptions 45 Current Debt Total Assets 3.5% 10.3% 2.9% 0.2% 0.2% 0.2% 0.2% 0.2% 0.2% 0.2% 0.2% 0.2% 0.2% 0.2% 0.2% 0.2% 46 Long-Term Debt Total Assets 32.8% 23.5% 32.0% 32.2% 32.2% 32.2% 32.2% 32.2% 32.2% 32.2% 32.2% 32.2% 32.2% 32.2% 32.2% 32.2% 47 Minority Interest/Total Assets 0.9% 0.4% 0.0% 0.0% 0.0% 0.0% 0.0% 0.0% 0.0% 0.0% 0.0% 0.0% 0.0% 0.0% 0.0% % 0.0% 48 Preferred Stock/Total Assets 0.0% 0.0% 0.0% 0.0% 0.0% 0.0% 0.0% 0.0% 0.0% 0.0% 0.0% 0.0% 0.0% % 0.0% 0.0% 0.0% 49 Dividend Payout Ratio 50.0% 45.1% 69.8% 140.3% 140.3% 140.3% 140.3% 140.3% 140.3% 140.3% 140.3% 140.3% 140.3% 140.3% 140.3% 140.3% 1 Financial Statements ($000s) Data can be entered manually in financial statements or 2 paste from the Case Data Sheet to the Raw Data Input 3 Jump to Raw Data Input 4 Company Name and Ticker Hasbro inc HAS Link to Form 10-K 5 Common Shares Outstanding 136,863 (in 000s at most recent fiscal year end) 6 Estimated Price/Share=$18.13 7 Actual Actual Actual 8 Fiscal Year End (YYYY-MM-DD) 2015/12/27 2016/12/25 2017/12/31 81 82 Company Name and Ticker Hasbro inc HAS 83 Common Shares Outstanding 136,863 84 Fiscal Year End (YYYY-MM-DD 12/27/2015 12/25/2016 12/31/2017 12/30/2018 85 Sales (Net) 4,447,509 5,019,822 5,209,782 4,579,646 86 Cost of Goods Sold (2,056,278) (2,314,996 (2,033,693) (1,850,678 87 R&D Expense (242,944) (266,375) (269,020) (246,165 88 SG&A Expense (1,370,183) (1,579,709) (2,032,094) (2,079,142 89 Depreciation & Amortization (86,171) (70,694) (64,616) (72,609 90 Interest Expense (97,122) (97,405) (98,268) (90,826 91 Non-Operating Income (Loss) 9,104 1,846 74,059 30,176 92 Income Taxes (157,043) (159,338) (389,543) (49.968 93 Minority Interest in Earnings 4,966 18,229 0 0 94 Other Income (Loss) 0 0 0 0 95 Ext. Items & Disc. Ops. 0 0 0 0 96 Preferred Dividends 0 0 0 0 97 Operating Cash and Market. Sec. 976,750 1,282,285 1,581,234 1,182,371 98 Receivables 1,217,850 1,319,963 1,405,399 1,188,052 99 Inventories 384,492 387,675 433,293 443,383 100 Other Current Assets 286,506 237,684 214,000 268,698 101 PP&E (Net) 237,527 267,398 259,710 256,473 102 Investments 0 0 0 0 103 Intangibles 873,502 816,504 790,445 1,179,723 104 Other Assets 744,090 779,857 605,902 744,288 105 Current Debt 164,563 522,295 154,957 9,740 106 Accounts Payable 241,210 319,525 348,476 333,521 107 Income Taxes Payable 0 0 0 0 108 Other Current Liabilities 658,874 776,039 748,264 931,063 109 Long-Term Debt 1,547,115 1,198,679 1,693,609 1,695,092 110 Other Liabilities 404,883 389,388 514,720 539,086 111 Deferred Taxes 0 0 112 Minority Interest 40,170 22,704 0 0 113 Preferred Stock 0 0 0 0 114 Paid in Common Capital (Net) (2,188,419) (2.285,986 (2,430,265) (2.429,888 115 Retained Earnings 3,852,321 4,148,722 4,260,222 4,184,374 116 Common Dividends 225,797 248,881 276,973 309,258 Intro Financial Statements Ratio Analysis | Cash Flow Analysis Credit Analysis