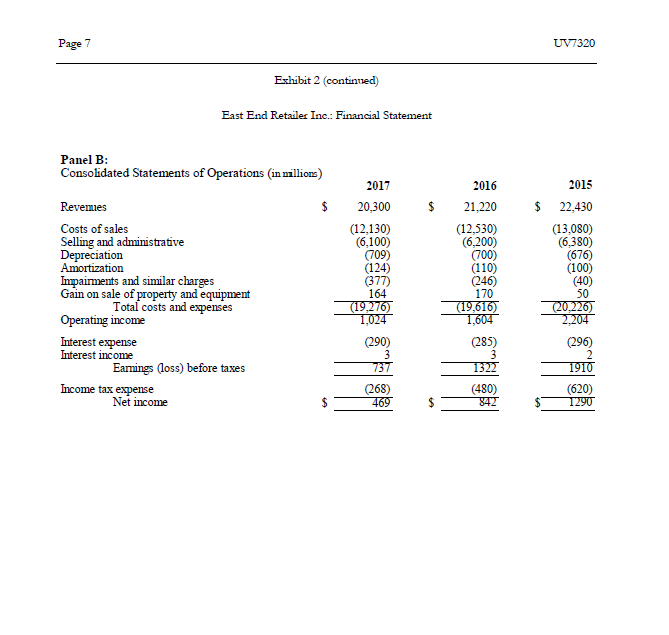
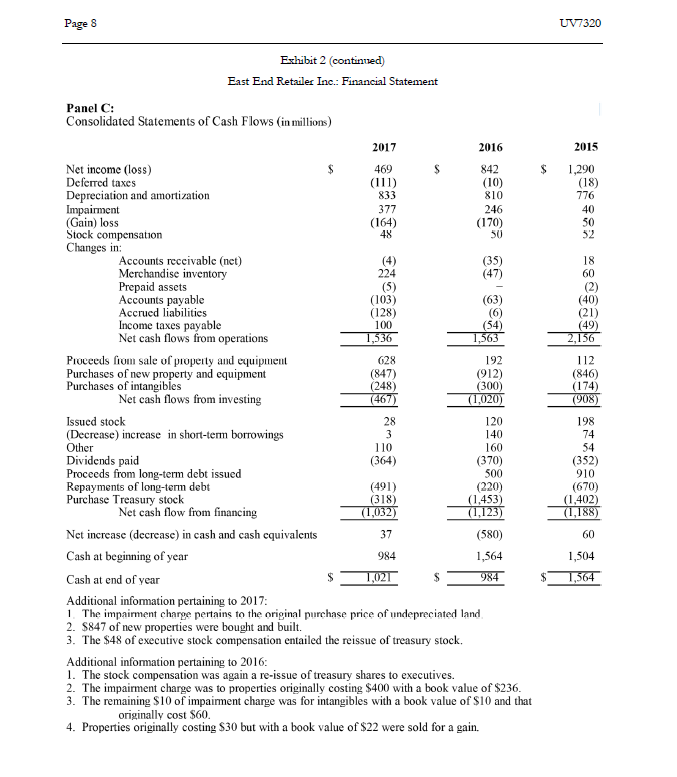
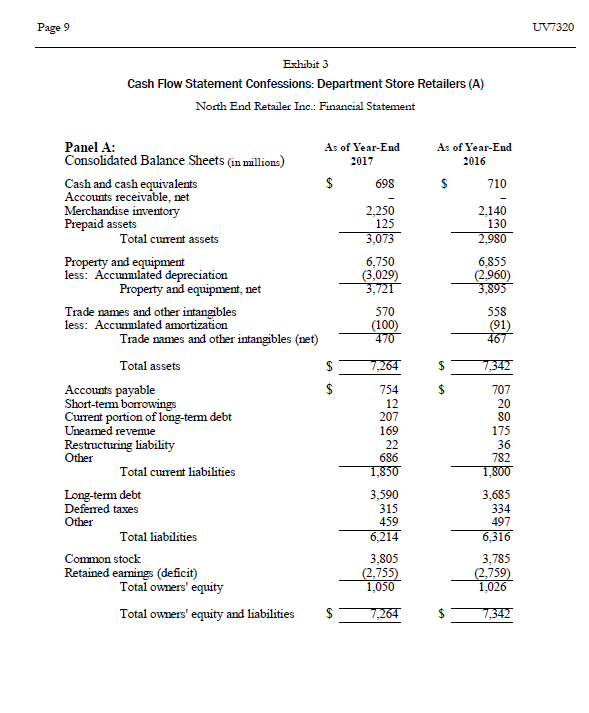
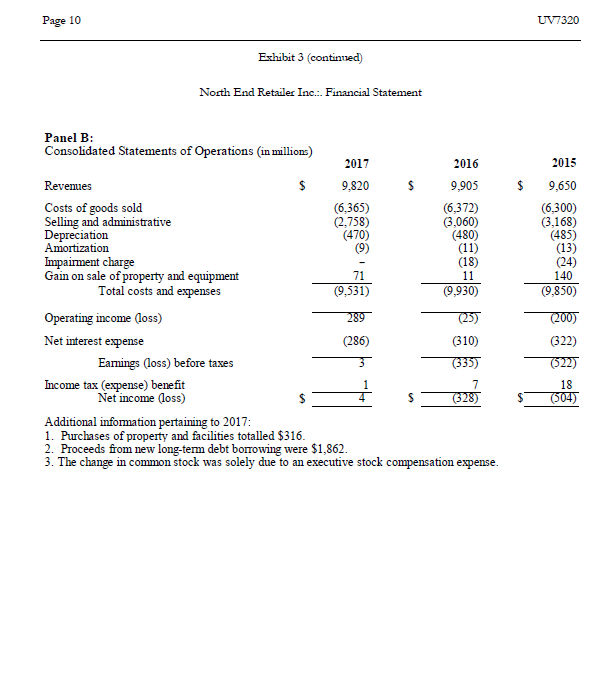
- Prepare the 2017 Statement of Cash Flows for North End Retailer, Inc. using the indirect method.
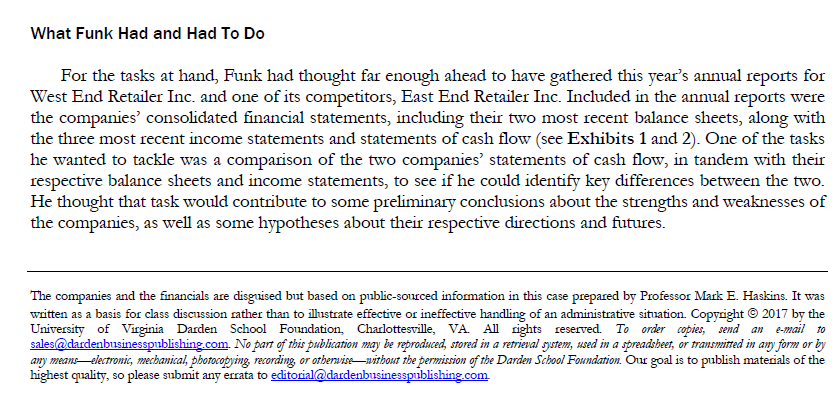
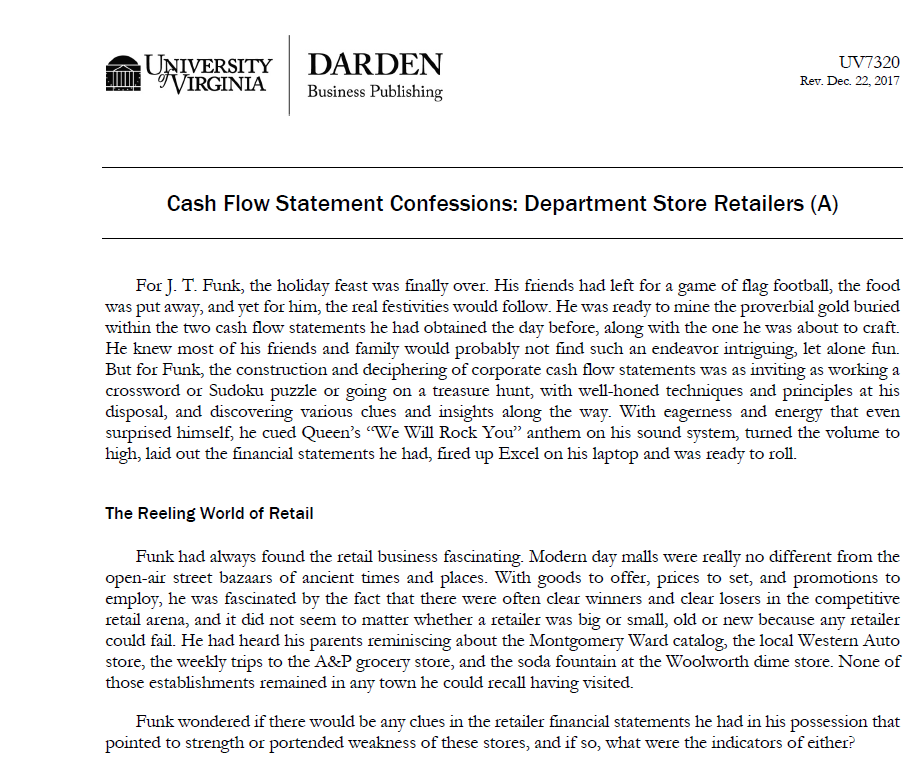
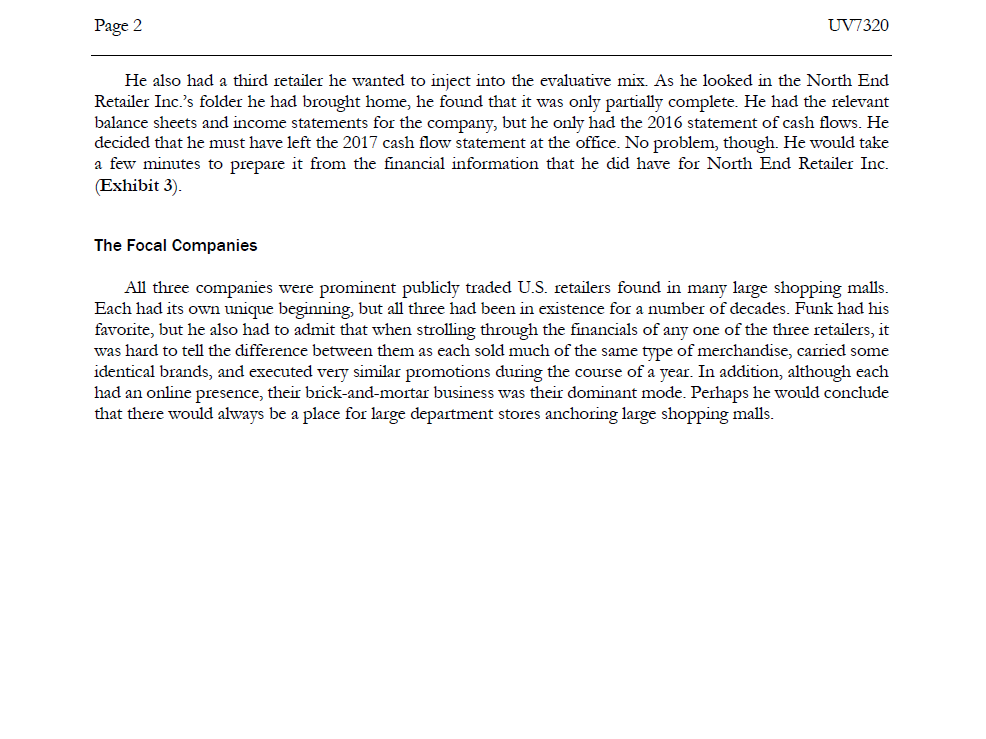
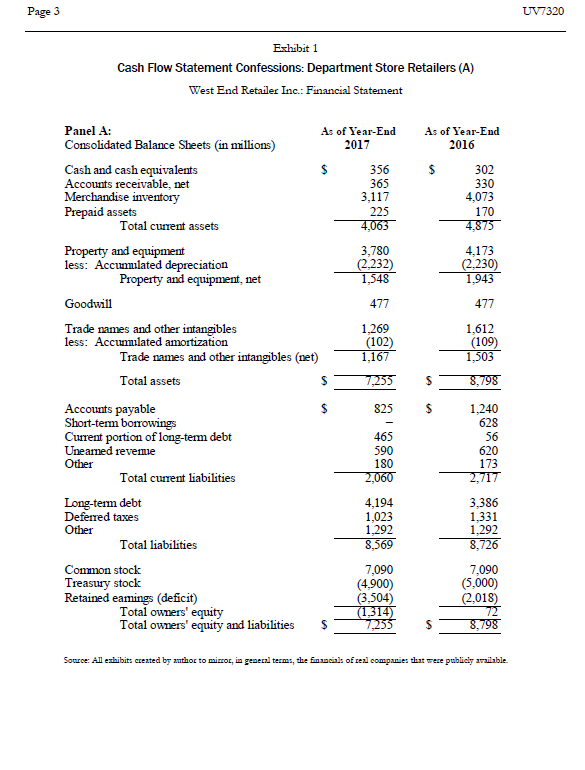
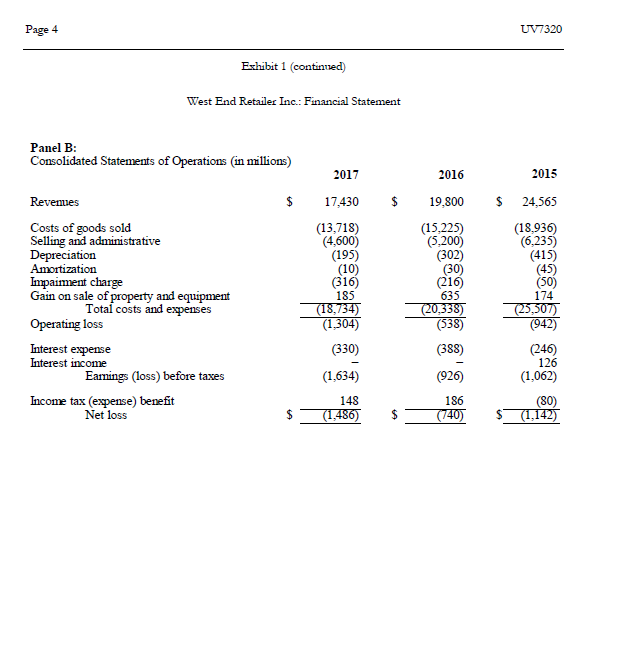
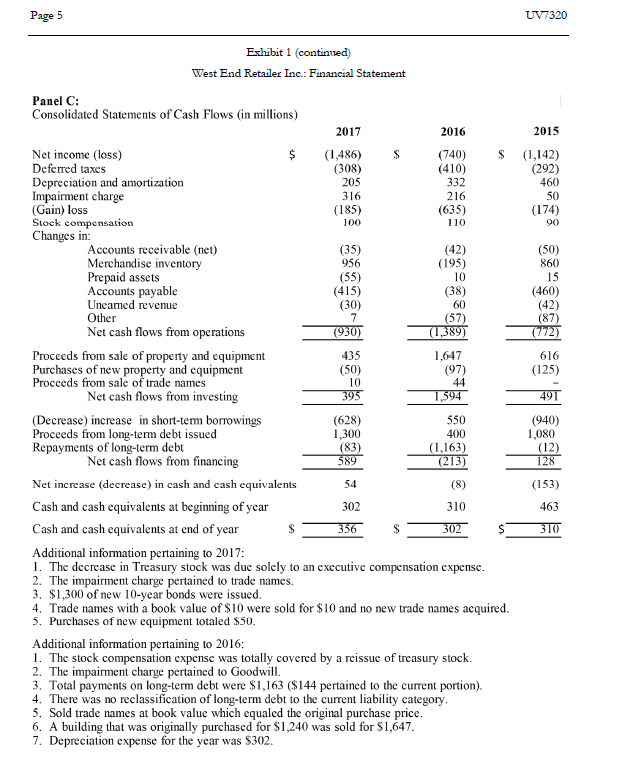
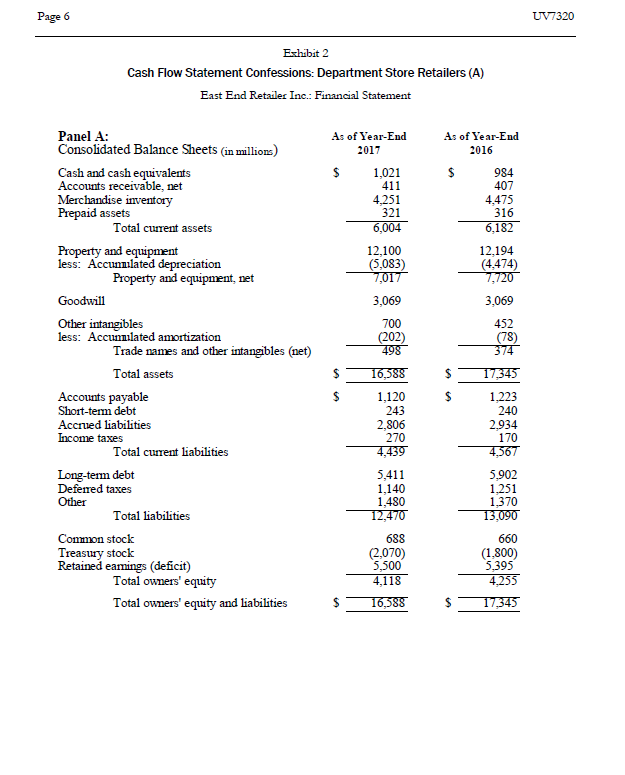
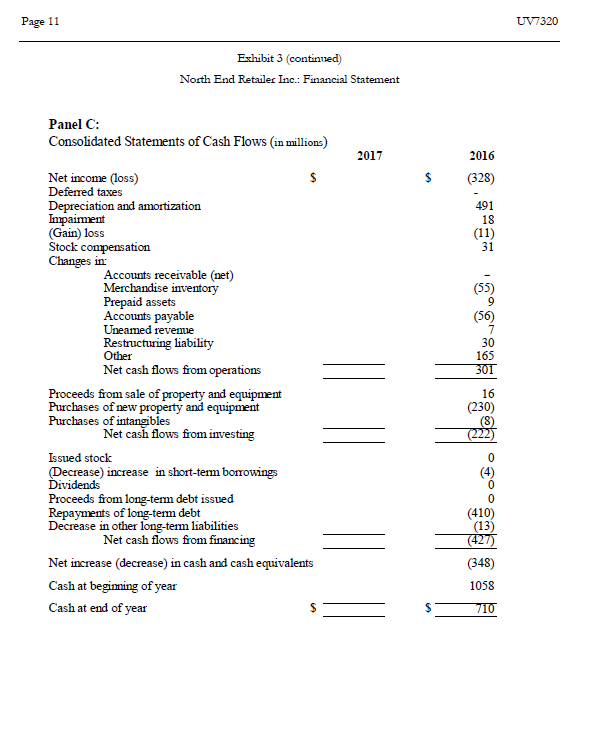
UNIVERSITY LUMOTVIRGINIA DARDEN Business Publishing UV7320 Rev. Dec. 22, 2017 Cash Flow Statement Confessions: Department Store Retailers (A) For J. T. Funk, the holiday feast was finally over. His friends had left for a game of flag football, the food was put away, and yet for him, the real festivities would follow. He was ready to mine the proverbial gold buried within the two cash flow statements he had obtained the day before, along with the one he was about to craft. He knew most of his friends and family would probably not find such an endeavor intriguing, let alone fun. But for Funk, the construction and deciphering of corporate cash flow statements was as inviting as working a crossword or Sudoku puzzle or going on a treasure hunt, with well-honed techniques and principles at his disposal, and discovering various clues and insights along the way. With eagerness and energy that even surprised himself, he cued Queen's "We Will Rock You" anthem on his sound system, turned the volume to high, laid out the financial statements he had, fired up Excel on his laptop and was ready to roll. The Reeling World of Retail Funk had always found the retail business fascinating. Modern day malls were really no different from the open-air street bazaars of ancient times and places. With goods to offer, prices to set, and promotions to employ, he was fascinated by the fact that there were often clear winners and clear losers in the competitive retail arena, and it did not seem to matter whether a retailer was big or small, old or new because any retailer could fail. He had heard his parents reminiscing about the Montgomery Ward catalog, the local Western Auto store, the weekly trips to the A&P grocery store, and the soda fountain at the Woolworth dime store. None of those establishments remained in any town he could recall having visited. Funk wondered if there would be any clues in the retailer financial statements he had in his possession that pointed to strength or portended weakness of these stores, and if so, what were the indicators of either? Page 2 UV7320 He also had a third retailer he wanted to inject into the evaluative mix. As he looked in the North End Retailer Inc.'s folder he had brought home, he found that it was only partially complete. He had the relevant balance sheets and income statements for the company, but he only had the 2016 statement of cash flows. He decided that he must have left the 2017 cash flow statement at the office. No problem, though. He would take a few minutes to prepare it from the financial information that he did have for North End Retailer Inc. (Exhibit 3). The Focal Companies All three companies were prominent publicly traded U.S. retailers found in many large shopping malls. Each had its own unique beginning, but all three had been in existence for a number of decades. Funk had his favorite, but he also had to admit that when strolling through the financials of any one of the three retailers, it was hard to tell the difference between them as each sold much of the same type of merchandise, carried some identical brands, and executed very similar promotions during the course of a year. In addition, although each had an online presence, their brick-and-mortar business was their dominant mode. Perhaps he would conclude that there would always be a place for large department stores anchoring large shopping malls. Page 3 UV7320 Exhibit 1 Cash Flow Statement Confessions: Department Store Retailers (A) West End Retailer Inc.: Financial Statement As of Year-End 2017 As of Year-End 2016 $ Panel A: Consolidated Balance Sheets (in millions) Cash and cash equivalents Accounts receivable, net Merchandise inventory Prepaid assets Total current assets Property and equipment less: Accunnilated depreciation Property and equipment, net Goodwill 356 365 3,117 225 302 330 4,073 170 4.875 4,063 4,173 (2.230) 3,780 (2,232) 1,548 477 1,943 477 1.612 (109) Trade names and other intangibles less: Accumulated amortization Trade names and other intangibles (net) Total assets $ 1,269 (102) 1,167 7,255 1,503 $ 8,798 825 $ Accounts payable Short-term borrowings Current portion of long-term debt Uneamed reveme Other Total current liabilities 465 590 180 2,060 1,240 628 56 620 173 2,717 Long-term debt Deferred taxes Other Total liabilities 4,194 1,023 1,292 8,569 3,386 1,331 1,292 8,726 Common stock Treasury stock Retained eamings (deficit) Total owners' equity Total owners' equity and liabilities 7,090 (4,900) (3,504) (1,314) 7.255 7,090 (5,000) (2.018) 72 8,798 $ Source: All exhibits created by author to mirror, in general terms, the financials of real companies that were publicly available Page 4 UV7320 Exhibit 1 (continued) West End Retailer Inc.: Financial Statement Panel B: Consolidated Statements of Operations in millions) 2017 2016 2015 Revenues 17,430 $ 19,800 $ 24,565 Costs of goods sold Selling and administrative Depreciation Amortization Impaiment charge Gain on sale of property and equipment Total costs and expenses Operating loss (13,718) (4.600) (195) (10) (316) 185 (18,734) (1.304) (15,225) (5,200) (302) (30) (216) (18.936) (6,235) (415) (45) (50) 174 (25,507) 635 (20.338) (538) (942) (388) (246) Interest expense Interest income Earnings (loss) before taxes Income tax (expense) benefit Net loss (330) (1,634) 126 (926) (1,062) $ 148 (1,486) $ 186 (740) $ (80) (1,142) Page 6 UV7320 Exhibit 2 Cash Flow Statement Confessions: Department Store Retailers (A) East End Retailer Inc.: Financial Statement As of Year-End 2017 As of Year-End 2016 $ 1,021 411 4,251 321 984 407 4,475 316 6,004 6.182 Panel A: Consolidated Balance Sheets (in millions) Cash and cash equivalents Accounts receivable, net Merchandise inventory Prepaid assets Total current assets Property and equipment less: Accunnilated depreciation Property and equipment, net Goodwill Other intangibles less: Accunnilated amortization Trade names and other intangibles (net) Total assets 12,100 (5,083) 7,017 3,069 700 (202) 12,194 (4,474) 7,720 3,069 452 (78) 374 $ 16,388 $ 1,120 243 2.806 270 4,439 Accounts payable Short-term debt Accrued liabilities Income taxes Total current liabilities Long-term debt Deferred taxes Other Total liabilities Common stock Treasury stock Retained earnings (deficit) Total owners' equity Total owners' equity and liabilities 17,345 1.223 240 2,934 170 4,567 5,902 1,251 1.370 13,090 5,411 1.140 1,480 12,470 688 (2,070) 5,500 4,118 16,588 660 (1,800) 5,395 4.255 17.345 $ $ Page 7 UV7320 Exhibit 2 (continued) East End Retailer Inc.: Financial Statement Panel B: Consolidated Statements of Operations in million) Revemies $ Costs of sales Selling and administrative Depreciation Amortization Impairments and similar charges Gain on sale of property and equipment Total costs and expenses Operating income Interest expense Interest income Earings (loss) before taxes Income tax expense Net income 2017 20,300 (12,130) (6,100) (709) (124) (377) 164 (19,276) 1,024 2016 21,220 (12,530) (6,200) (700) (110) (246) 170 (19,616) 1,604 (285) 1322 (480) 842 2015 22,430 (13,080) (6,380) (676) (100) (40) 50 (20.226) 2,204 (296) 1910 (620) 1290 (290) 737 $ (268) 469 $ $ Page 8 UV7320 Exhibit 2 (continued) East End Retailer Inc.: Financial Statement Panel C: Consolidated Statements of Cash Flows (in millions) 2015 1,290 (18) 776 48 (2) (40) (21) (49) 2,156 112 (846) (174) (908) 198 2017 2016 Net income (loss) 469 S 842 Deferred taxes (111) (10) Depreciation and amortization 833 810 Impairment 377 246 (Gain) loss (164) (170) Stock compensation Changes in: Accounts receivable (net) (4) (35) Merchandise inventory 224 (47) Prepaid assets (5) Accounts payable (103) (63) Accrued liabilities (128) (6) Income taxes payable 100 (54) Net cash flows from operations 1,536 1,563 Proceeds from sale of property and equipment 628 192 Purchases of new property and equipment (847) (912) Purchases of intangibles (248) (300) Net cash flows from investing (467) (1,020) Issued stock 28 120 (Decrease) increase in short-term borrowings 140 Other 110 Dividends paid (364) (370) Proceeds from long-term debt issued 500 Repayments of long-term debt (491) (220) Purchase Treasury stock (318) (1,453) Net cash flow from financing (1,032) (1,123) Net increase (decrease) in cash and cash equivalents (580) Cash at beginning of year 984 1,564 Cash at end of year $ 1,021 $ 984 Additional information pertaining to 2017: 1. The impairment charge pertains to the original purchase price of undepreciated land 2. $847 of new properties were bought and built. 3. The $48 of executive stock compensation entailed the reissue of treasury stock. Additional information pertaining to 2016: 1. The stock compensation was again a re-issue of treasury shares to executives. 2. The impairment charge was to properties originally costing $400 with a book value of $236. 3. The remaining S10 of impairment charge was for intangibles with a book value of $10 and that originally cost $60. 4. Properties originally costing $30 but with a book value of $22 were sold for a gain. 160 54 (352) 910 (670) (1,402) (1,188) 60 1,504 1,564 $ Page 10 UV7320 Exhibit 3 (continued) North End Retriler Ine: Financial Statement Panel B: Consolidated Statements of Operations in million) S $ Revemes Costs of goods sold Selling and administrative Depreciation Amortization Impairment charge Gain on sale of property and equipment Total costs and expenses 2017 9,820 (6.365) (2.758) (470) 2016 9,905 (6,372) (3,060) (480) (11) (18) 11 (9,930) 2015 9,650 (6,300) (3,168) (485) (13) (24) 140 (9,850) 71 (9.531) (333) Operating income (loss) Net interest expense (286) (310) Earings (loss) before taxes Income tax (expense) benefit Net income (loss) Additional information pertaining to 2017: 1. Purchases of property and facilities totalled $316. 2. Proceeds from new long-term debt borrowing were $1,862. 3. The change in common stock was solely due to an executive stock compensation expense. (200) (322) (22) 18 (504) (328) Page 11 UV7320 Exhibit 3 (continued) North End Retailer Inc.: Financial Statement Panel C: Consolidated Statements of Cash Flows (in millions) 2017 2016 (328) 301 Net income (loss) Deferred taxes Depreciation and amortization Impairment (Gain) loss Stock compensation Changes in Accounts receivable (net) Merchandise inventory Prepaid assets Accounts payable Uneamed reveme Restructuring liability Other Net cash flows from operations Proceeds from sale of property and equipment Purchases of new property and equipment Purchases of intangibles Net cash flows from investing Issued stock (Decrease) increase in short-term borrowings Dividends Proceeds from long-term debt issued Repayments of long-term debt Decrease in other long-term liabilities Net cash flows from financing Net increase (decrease) in cash and cash equivalents Cash at begiming of year Cash at end of year 16 (230) (410) (13) (427) (348) 1058 710 $ UNIVERSITY LUMOTVIRGINIA DARDEN Business Publishing UV7320 Rev. Dec. 22, 2017 Cash Flow Statement Confessions: Department Store Retailers (A) For J. T. Funk, the holiday feast was finally over. His friends had left for a game of flag football, the food was put away, and yet for him, the real festivities would follow. He was ready to mine the proverbial gold buried within the two cash flow statements he had obtained the day before, along with the one he was about to craft. He knew most of his friends and family would probably not find such an endeavor intriguing, let alone fun. But for Funk, the construction and deciphering of corporate cash flow statements was as inviting as working a crossword or Sudoku puzzle or going on a treasure hunt, with well-honed techniques and principles at his disposal, and discovering various clues and insights along the way. With eagerness and energy that even surprised himself, he cued Queen's "We Will Rock You" anthem on his sound system, turned the volume to high, laid out the financial statements he had, fired up Excel on his laptop and was ready to roll. The Reeling World of Retail Funk had always found the retail business fascinating. Modern day malls were really no different from the open-air street bazaars of ancient times and places. With goods to offer, prices to set, and promotions to employ, he was fascinated by the fact that there were often clear winners and clear losers in the competitive retail arena, and it did not seem to matter whether a retailer was big or small, old or new because any retailer could fail. He had heard his parents reminiscing about the Montgomery Ward catalog, the local Western Auto store, the weekly trips to the A&P grocery store, and the soda fountain at the Woolworth dime store. None of those establishments remained in any town he could recall having visited. Funk wondered if there would be any clues in the retailer financial statements he had in his possession that pointed to strength or portended weakness of these stores, and if so, what were the indicators of either? Page 2 UV7320 He also had a third retailer he wanted to inject into the evaluative mix. As he looked in the North End Retailer Inc.'s folder he had brought home, he found that it was only partially complete. He had the relevant balance sheets and income statements for the company, but he only had the 2016 statement of cash flows. He decided that he must have left the 2017 cash flow statement at the office. No problem, though. He would take a few minutes to prepare it from the financial information that he did have for North End Retailer Inc. (Exhibit 3). The Focal Companies All three companies were prominent publicly traded U.S. retailers found in many large shopping malls. Each had its own unique beginning, but all three had been in existence for a number of decades. Funk had his favorite, but he also had to admit that when strolling through the financials of any one of the three retailers, it was hard to tell the difference between them as each sold much of the same type of merchandise, carried some identical brands, and executed very similar promotions during the course of a year. In addition, although each had an online presence, their brick-and-mortar business was their dominant mode. Perhaps he would conclude that there would always be a place for large department stores anchoring large shopping malls. Page 3 UV7320 Exhibit 1 Cash Flow Statement Confessions: Department Store Retailers (A) West End Retailer Inc.: Financial Statement As of Year-End 2017 As of Year-End 2016 $ Panel A: Consolidated Balance Sheets (in millions) Cash and cash equivalents Accounts receivable, net Merchandise inventory Prepaid assets Total current assets Property and equipment less: Accunnilated depreciation Property and equipment, net Goodwill 356 365 3,117 225 302 330 4,073 170 4.875 4,063 4,173 (2.230) 3,780 (2,232) 1,548 477 1,943 477 1.612 (109) Trade names and other intangibles less: Accumulated amortization Trade names and other intangibles (net) Total assets $ 1,269 (102) 1,167 7,255 1,503 $ 8,798 825 $ Accounts payable Short-term borrowings Current portion of long-term debt Uneamed reveme Other Total current liabilities 465 590 180 2,060 1,240 628 56 620 173 2,717 Long-term debt Deferred taxes Other Total liabilities 4,194 1,023 1,292 8,569 3,386 1,331 1,292 8,726 Common stock Treasury stock Retained eamings (deficit) Total owners' equity Total owners' equity and liabilities 7,090 (4,900) (3,504) (1,314) 7.255 7,090 (5,000) (2.018) 72 8,798 $ Source: All exhibits created by author to mirror, in general terms, the financials of real companies that were publicly available Page 4 UV7320 Exhibit 1 (continued) West End Retailer Inc.: Financial Statement Panel B: Consolidated Statements of Operations in millions) 2017 2016 2015 Revenues 17,430 $ 19,800 $ 24,565 Costs of goods sold Selling and administrative Depreciation Amortization Impaiment charge Gain on sale of property and equipment Total costs and expenses Operating loss (13,718) (4.600) (195) (10) (316) 185 (18,734) (1.304) (15,225) (5,200) (302) (30) (216) (18.936) (6,235) (415) (45) (50) 174 (25,507) 635 (20.338) (538) (942) (388) (246) Interest expense Interest income Earnings (loss) before taxes Income tax (expense) benefit Net loss (330) (1,634) 126 (926) (1,062) $ 148 (1,486) $ 186 (740) $ (80) (1,142) Page 6 UV7320 Exhibit 2 Cash Flow Statement Confessions: Department Store Retailers (A) East End Retailer Inc.: Financial Statement As of Year-End 2017 As of Year-End 2016 $ 1,021 411 4,251 321 984 407 4,475 316 6,004 6.182 Panel A: Consolidated Balance Sheets (in millions) Cash and cash equivalents Accounts receivable, net Merchandise inventory Prepaid assets Total current assets Property and equipment less: Accunnilated depreciation Property and equipment, net Goodwill Other intangibles less: Accunnilated amortization Trade names and other intangibles (net) Total assets 12,100 (5,083) 7,017 3,069 700 (202) 12,194 (4,474) 7,720 3,069 452 (78) 374 $ 16,388 $ 1,120 243 2.806 270 4,439 Accounts payable Short-term debt Accrued liabilities Income taxes Total current liabilities Long-term debt Deferred taxes Other Total liabilities Common stock Treasury stock Retained earnings (deficit) Total owners' equity Total owners' equity and liabilities 17,345 1.223 240 2,934 170 4,567 5,902 1,251 1.370 13,090 5,411 1.140 1,480 12,470 688 (2,070) 5,500 4,118 16,588 660 (1,800) 5,395 4.255 17.345 $ $ Page 7 UV7320 Exhibit 2 (continued) East End Retailer Inc.: Financial Statement Panel B: Consolidated Statements of Operations in million) Revemies $ Costs of sales Selling and administrative Depreciation Amortization Impairments and similar charges Gain on sale of property and equipment Total costs and expenses Operating income Interest expense Interest income Earings (loss) before taxes Income tax expense Net income 2017 20,300 (12,130) (6,100) (709) (124) (377) 164 (19,276) 1,024 2016 21,220 (12,530) (6,200) (700) (110) (246) 170 (19,616) 1,604 (285) 1322 (480) 842 2015 22,430 (13,080) (6,380) (676) (100) (40) 50 (20.226) 2,204 (296) 1910 (620) 1290 (290) 737 $ (268) 469 $ $ Page 8 UV7320 Exhibit 2 (continued) East End Retailer Inc.: Financial Statement Panel C: Consolidated Statements of Cash Flows (in millions) 2015 1,290 (18) 776 48 (2) (40) (21) (49) 2,156 112 (846) (174) (908) 198 2017 2016 Net income (loss) 469 S 842 Deferred taxes (111) (10) Depreciation and amortization 833 810 Impairment 377 246 (Gain) loss (164) (170) Stock compensation Changes in: Accounts receivable (net) (4) (35) Merchandise inventory 224 (47) Prepaid assets (5) Accounts payable (103) (63) Accrued liabilities (128) (6) Income taxes payable 100 (54) Net cash flows from operations 1,536 1,563 Proceeds from sale of property and equipment 628 192 Purchases of new property and equipment (847) (912) Purchases of intangibles (248) (300) Net cash flows from investing (467) (1,020) Issued stock 28 120 (Decrease) increase in short-term borrowings 140 Other 110 Dividends paid (364) (370) Proceeds from long-term debt issued 500 Repayments of long-term debt (491) (220) Purchase Treasury stock (318) (1,453) Net cash flow from financing (1,032) (1,123) Net increase (decrease) in cash and cash equivalents (580) Cash at beginning of year 984 1,564 Cash at end of year $ 1,021 $ 984 Additional information pertaining to 2017: 1. The impairment charge pertains to the original purchase price of undepreciated land 2. $847 of new properties were bought and built. 3. The $48 of executive stock compensation entailed the reissue of treasury stock. Additional information pertaining to 2016: 1. The stock compensation was again a re-issue of treasury shares to executives. 2. The impairment charge was to properties originally costing $400 with a book value of $236. 3. The remaining S10 of impairment charge was for intangibles with a book value of $10 and that originally cost $60. 4. Properties originally costing $30 but with a book value of $22 were sold for a gain. 160 54 (352) 910 (670) (1,402) (1,188) 60 1,504 1,564 $ Page 10 UV7320 Exhibit 3 (continued) North End Retriler Ine: Financial Statement Panel B: Consolidated Statements of Operations in million) S $ Revemes Costs of goods sold Selling and administrative Depreciation Amortization Impairment charge Gain on sale of property and equipment Total costs and expenses 2017 9,820 (6.365) (2.758) (470) 2016 9,905 (6,372) (3,060) (480) (11) (18) 11 (9,930) 2015 9,650 (6,300) (3,168) (485) (13) (24) 140 (9,850) 71 (9.531) (333) Operating income (loss) Net interest expense (286) (310) Earings (loss) before taxes Income tax (expense) benefit Net income (loss) Additional information pertaining to 2017: 1. Purchases of property and facilities totalled $316. 2. Proceeds from new long-term debt borrowing were $1,862. 3. The change in common stock was solely due to an executive stock compensation expense. (200) (322) (22) 18 (504) (328) Page 11 UV7320 Exhibit 3 (continued) North End Retailer Inc.: Financial Statement Panel C: Consolidated Statements of Cash Flows (in millions) 2017 2016 (328) 301 Net income (loss) Deferred taxes Depreciation and amortization Impairment (Gain) loss Stock compensation Changes in Accounts receivable (net) Merchandise inventory Prepaid assets Accounts payable Uneamed reveme Restructuring liability Other Net cash flows from operations Proceeds from sale of property and equipment Purchases of new property and equipment Purchases of intangibles Net cash flows from investing Issued stock (Decrease) increase in short-term borrowings Dividends Proceeds from long-term debt issued Repayments of long-term debt Decrease in other long-term liabilities Net cash flows from financing Net increase (decrease) in cash and cash equivalents Cash at begiming of year Cash at end of year 16 (230) (410) (13) (427) (348) 1058 710 $