- Prepare the hypothesis testing (values and interpretation).
Hypothesis: Independent variables (motivation (X1); discipline (X2) & work environment (X3) have a significant effect on Dependent Variable (Employee Performance (Y)).
- Multiple Regression Analysis. (22 marks)
- T Test (Partial, sig.= 0.05 & t-table = 2.008). (18 marks)
- F Test (Simulants, sig.= 0.05 & f-table = 2.78). (6 marks)
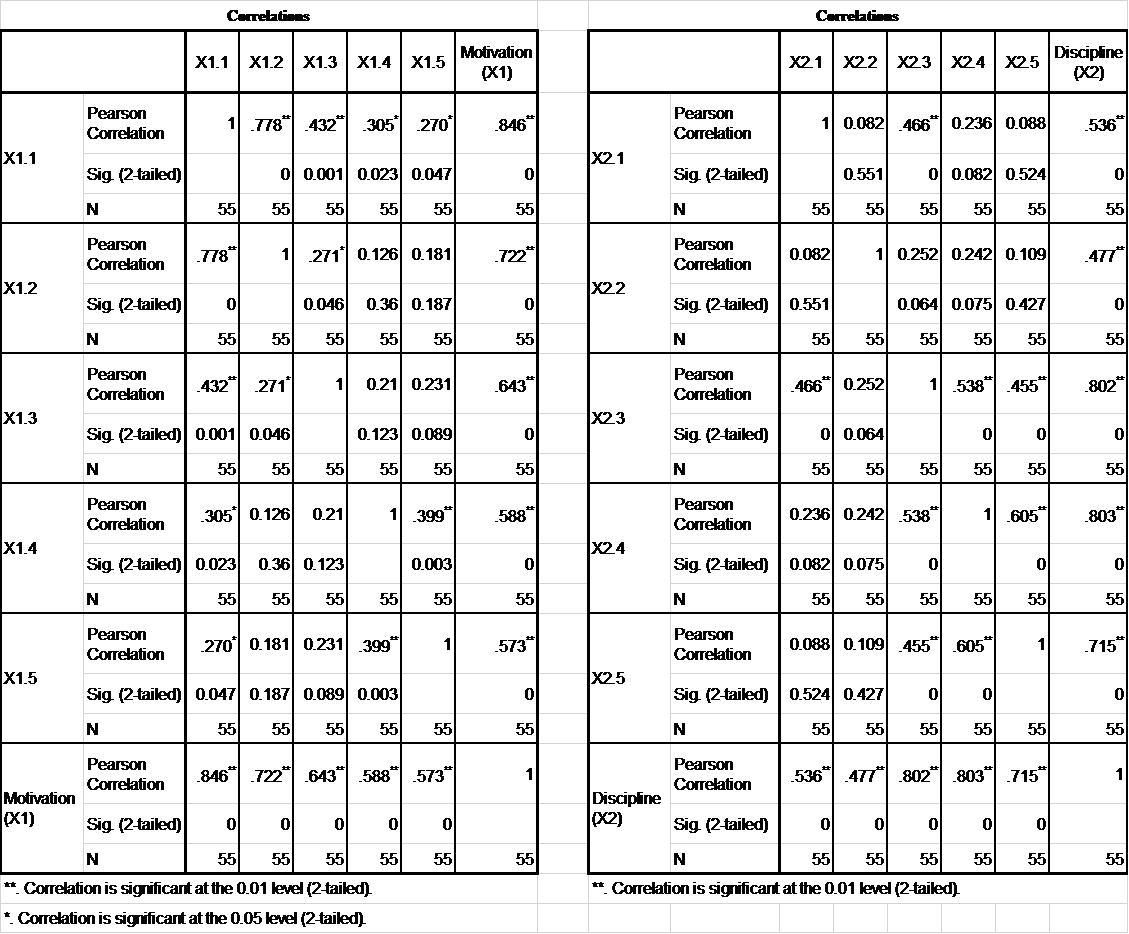
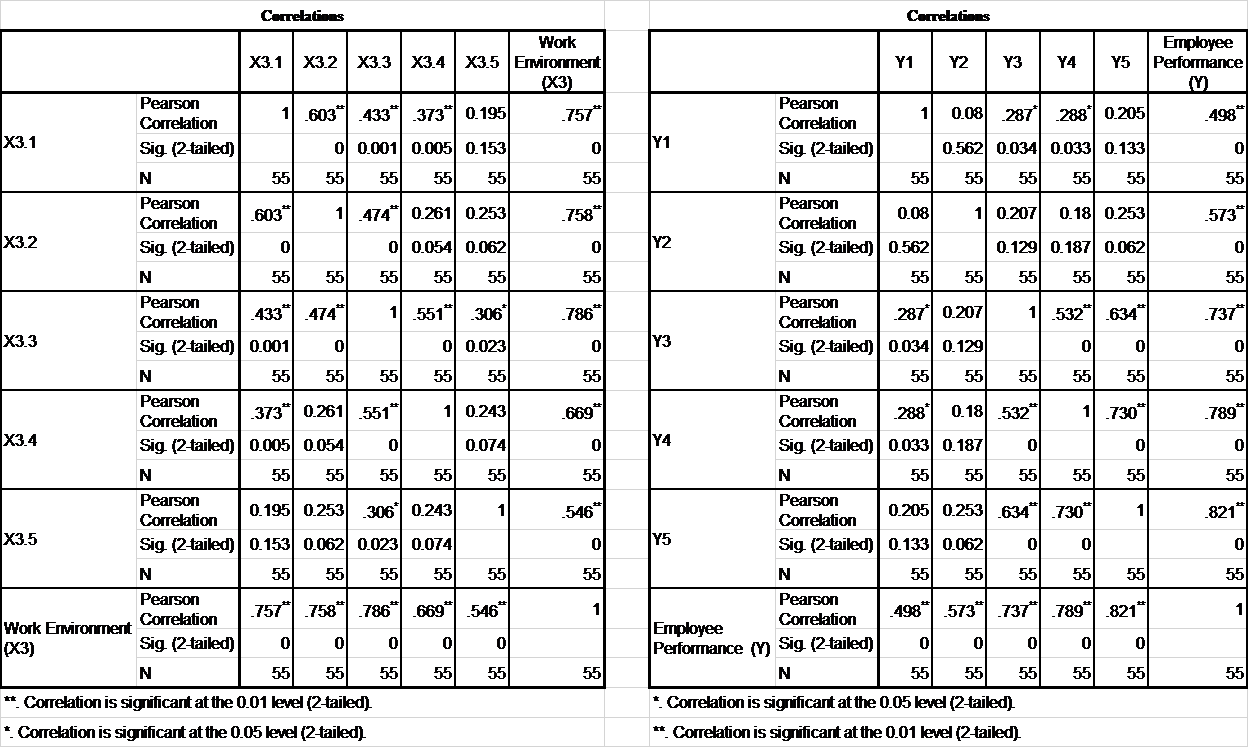
Carrelatines Carrelations X1.1 X1.2 X1.3 X1.4 X1.5 Motivation (X1) X21 X22X23 X24 X25 Discipline (X2) Pearson Correlation 1 778*432 305* 270 846" Pearson Correlation 1 0.082 466 0.236 0.088 536 X1.1 X21 Sig (2-tailed) 0 0.001 0.023 0.047 0 Sig (2-tailed) 0.551 0 0.082 0.524 0 N 55 55 55 55 55 55 N 55 55 55 55 55 55 Pearson Correlation 778" 1 271 0.126 0.181 722* Pearson Correlation 0.082 1 0.252 0.242] 0.109 477 X1.2 |X22 Sig (2-tailed) 0 0.046 0.36 0.187 0 Sig (2-tailed) 0.551 0.064 0.075 0.427 0 N 55 55 55 55 55 55 N 55 55 55 55 55 55 Pearson Correlation 432") 271" 1 0.21 0.231 .643 Pearson Correlation 466" 0.252 1 538 455 -802 X1.3 X23 Sig (2-tailed) 0.001 0.046 0.123 0.089) 0 Sig (2-tailed) 0 0.064 0 0 0 N 55 55 55 55 55 55 N 55 55 551 55 55 55 Pearson Correlation 305 | 0.126 0.21 1 399 Pearson Correlation 0.236 0.242538* 1 605* 803" X1.4 |X24 Sig (2-tailed) 0.023 0.36 0.123 0.003 0 Sig (2-tailed) 0.082 0.075 0 0 N 55 55 55 55 55 55 N 55 55 55 55 55 55 Pearson Correlation 270* 0.181 0.231 399* 1 -573** Pearson Correlation 0.088 0.109 455 605* 1 715" X1.5 X25 Sig (2-tailed) 0.047 0.187 0.089 0.003 0 Sig (2-tailed) 0.524 0.427 ol 0 N 55 55 55 55 55 55 N 55 55 55 55 55 Pearson Correlation 846 722 643*588* .573* 1 Pearson Correlation .536 477 802 803* .715" 1 Motivation X1) Discipline X2) Sig (2-tailed) 0 0 0 0 ol Sig (2-tailed) 0 0 0 0 0 55 55 55 55 55 55 N 55 55 55 *. Correlation is significant at the 0.01 level (2-tailed) * Correlation is significant at the 0.05 level (2-tailed) N 55 55 55 *. Correlation is significant at the 0.01 level (2-tailed) Camelaties Carrelations Y1 Employee Performance Y2 Y3 Y4 Y5 498 Y1 0 o 55 573* 0 551 786* .737 0 . 55 Work X3.1 X32 X3.3 X3.4 X3.5 Ermironment X3) Pearson 1 603*-| .433) 373" 0.195 Correlation -757 X3.1 Sig (2-tailed) 0 0.001 0.005 0.153 0 N 55 55 55 55 55 55 Pearson 603" 1 474" 0.261 0.253 Correlation .758 X32 Sig (2-tailed) 0 0 0.054 0.062 0 N 55 551 55 55 55 55 Pearson Correlation -433*) -474" 1 551 306* X3.3 Sig (2-tailed) 0.001 0 ol 0.023 N 55 55 55 551 55 55 Pearson 373 0.261 551" 1 0.243 669 Correlation X3.4 Sig (2-tailed) 0.005 0.054 0 0.074 0 N 55 55 55 55 55 55 Pearson 0.195 0.253 306) 0.243 1 546" Correlation X3.5 Sig (2-tailed) 0.153 0.062 0.023 0.074 0 N 55 55 55 55 55 Pearson 1 .757 758 786 669* 546* Correlation Work Environment X3) Sig (2-tailed) 0 0 0 0 0 N 55 55 55 55 55 55 * Correlation is significant at the 0.01 level (2-tailed) * Correlation is significant at the 0.05 level (2-tailed) Pearson 0.08 287 288"| 0.205 Correlation Sig (2-tailed) 0.562 0.034 0.033 0.133 N 55 55 55 55 55 Pearson 0.08) 1 0.207 0.18 0.253 Correlation Y2 Sig (2-tailed) 0.562 0.129 0.187] 0.062 N 55 55 55 55 55 Pearson 287 0.207 1 532* 634 Correlation Y3 Sig (2-tailed) 0.034 0.129 0 0 N 55 55 55 55 55 Pearson 288* 0.181 532 1 .7305 Correlation Y4 Sig (2-tailed) 0.033 0.187 0 0 N 55 55 55 55 55 Pearson 0.205 0.253 634" .730" 1 Correlation Y5 Sig (2-tailed) 0.133 0.062 0 0 N 55 55 55 55 55 Pearson 498") .573| .737"| .789") 821* Correlation Employee 0 Performance (Y) Sig (2-tailed) 0 0 0 0 N 55 55 55 55 55 1 .789" 0 55 821" 0 55 55 1 55 * Correlation is significant at the 0.05 level (2-tailed) *. Correlation is significant at the 0.01 level (2-tailed) Carrelatines Carrelations X1.1 X1.2 X1.3 X1.4 X1.5 Motivation (X1) X21 X22X23 X24 X25 Discipline (X2) Pearson Correlation 1 778*432 305* 270 846" Pearson Correlation 1 0.082 466 0.236 0.088 536 X1.1 X21 Sig (2-tailed) 0 0.001 0.023 0.047 0 Sig (2-tailed) 0.551 0 0.082 0.524 0 N 55 55 55 55 55 55 N 55 55 55 55 55 55 Pearson Correlation 778" 1 271 0.126 0.181 722* Pearson Correlation 0.082 1 0.252 0.242] 0.109 477 X1.2 |X22 Sig (2-tailed) 0 0.046 0.36 0.187 0 Sig (2-tailed) 0.551 0.064 0.075 0.427 0 N 55 55 55 55 55 55 N 55 55 55 55 55 55 Pearson Correlation 432") 271" 1 0.21 0.231 .643 Pearson Correlation 466" 0.252 1 538 455 -802 X1.3 X23 Sig (2-tailed) 0.001 0.046 0.123 0.089) 0 Sig (2-tailed) 0 0.064 0 0 0 N 55 55 55 55 55 55 N 55 55 551 55 55 55 Pearson Correlation 305 | 0.126 0.21 1 399 Pearson Correlation 0.236 0.242538* 1 605* 803" X1.4 |X24 Sig (2-tailed) 0.023 0.36 0.123 0.003 0 Sig (2-tailed) 0.082 0.075 0 0 N 55 55 55 55 55 55 N 55 55 55 55 55 55 Pearson Correlation 270* 0.181 0.231 399* 1 -573** Pearson Correlation 0.088 0.109 455 605* 1 715" X1.5 X25 Sig (2-tailed) 0.047 0.187 0.089 0.003 0 Sig (2-tailed) 0.524 0.427 ol 0 N 55 55 55 55 55 55 N 55 55 55 55 55 Pearson Correlation 846 722 643*588* .573* 1 Pearson Correlation .536 477 802 803* .715" 1 Motivation X1) Discipline X2) Sig (2-tailed) 0 0 0 0 ol Sig (2-tailed) 0 0 0 0 0 55 55 55 55 55 55 N 55 55 55 *. Correlation is significant at the 0.01 level (2-tailed) * Correlation is significant at the 0.05 level (2-tailed) N 55 55 55 *. Correlation is significant at the 0.01 level (2-tailed) Camelaties Carrelations Y1 Employee Performance Y2 Y3 Y4 Y5 498 Y1 0 o 55 573* 0 551 786* .737 0 . 55 Work X3.1 X32 X3.3 X3.4 X3.5 Ermironment X3) Pearson 1 603*-| .433) 373" 0.195 Correlation -757 X3.1 Sig (2-tailed) 0 0.001 0.005 0.153 0 N 55 55 55 55 55 55 Pearson 603" 1 474" 0.261 0.253 Correlation .758 X32 Sig (2-tailed) 0 0 0.054 0.062 0 N 55 551 55 55 55 55 Pearson Correlation -433*) -474" 1 551 306* X3.3 Sig (2-tailed) 0.001 0 ol 0.023 N 55 55 55 551 55 55 Pearson 373 0.261 551" 1 0.243 669 Correlation X3.4 Sig (2-tailed) 0.005 0.054 0 0.074 0 N 55 55 55 55 55 55 Pearson 0.195 0.253 306) 0.243 1 546" Correlation X3.5 Sig (2-tailed) 0.153 0.062 0.023 0.074 0 N 55 55 55 55 55 Pearson 1 .757 758 786 669* 546* Correlation Work Environment X3) Sig (2-tailed) 0 0 0 0 0 N 55 55 55 55 55 55 * Correlation is significant at the 0.01 level (2-tailed) * Correlation is significant at the 0.05 level (2-tailed) Pearson 0.08 287 288"| 0.205 Correlation Sig (2-tailed) 0.562 0.034 0.033 0.133 N 55 55 55 55 55 Pearson 0.08) 1 0.207 0.18 0.253 Correlation Y2 Sig (2-tailed) 0.562 0.129 0.187] 0.062 N 55 55 55 55 55 Pearson 287 0.207 1 532* 634 Correlation Y3 Sig (2-tailed) 0.034 0.129 0 0 N 55 55 55 55 55 Pearson 288* 0.181 532 1 .7305 Correlation Y4 Sig (2-tailed) 0.033 0.187 0 0 N 55 55 55 55 55 Pearson 0.205 0.253 634" .730" 1 Correlation Y5 Sig (2-tailed) 0.133 0.062 0 0 N 55 55 55 55 55 Pearson 498") .573| .737"| .789") 821* Correlation Employee 0 Performance (Y) Sig (2-tailed) 0 0 0 0 N 55 55 55 55 55 1 .789" 0 55 821" 0 55 55 1 55 * Correlation is significant at the 0.05 level (2-tailed) *. Correlation is significant at the 0.01 level (2-tailed)