

Answered step by step
Verified Expert Solution
Question
1 Approved Answer
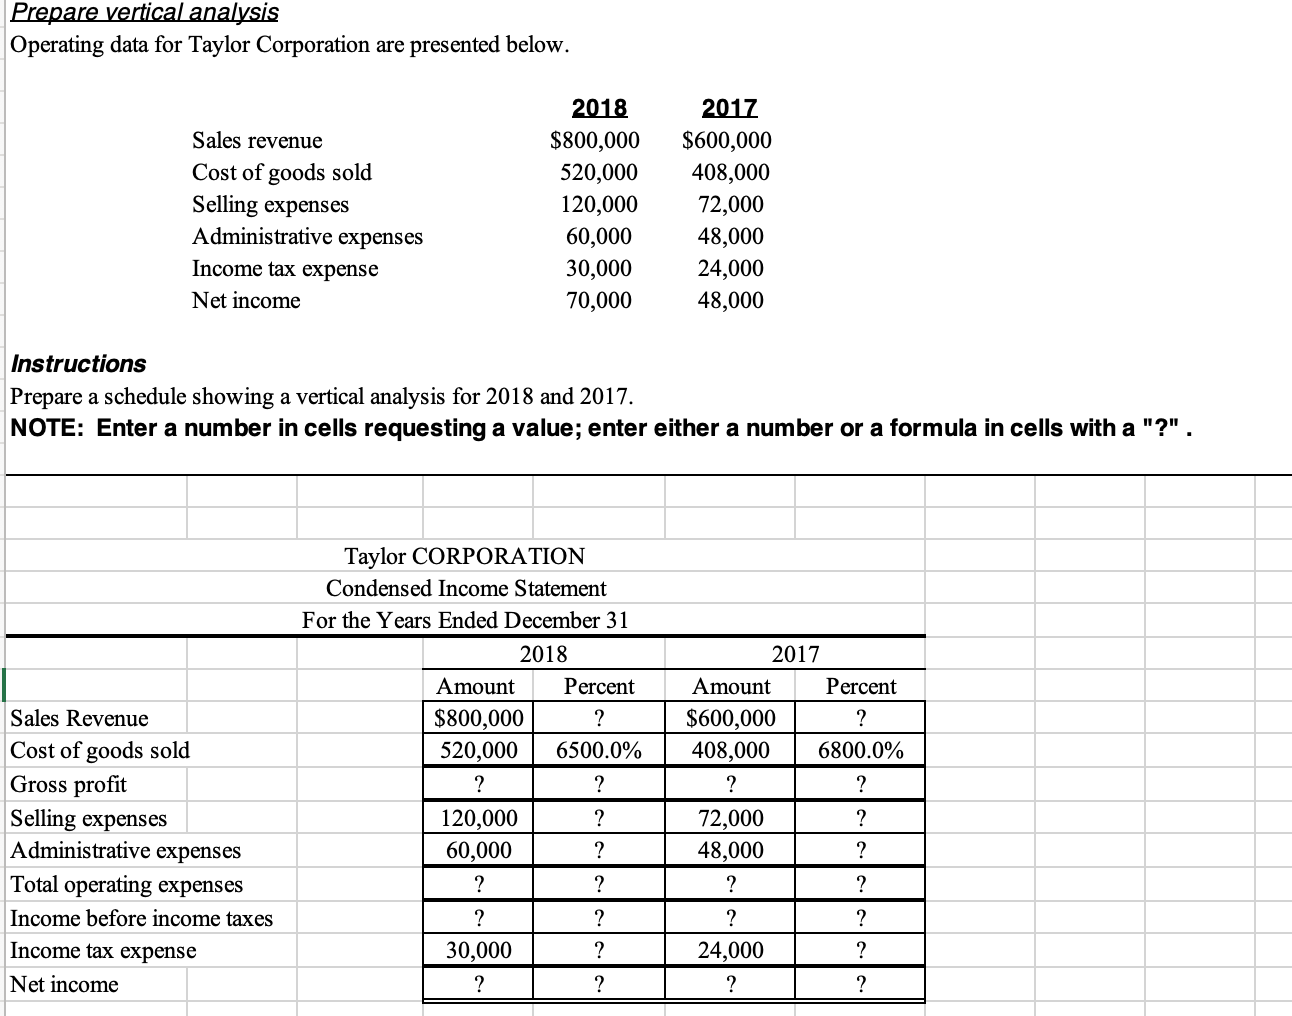
Prepare vertical analysis Operating data for Taylor Corporation are presented below. Sales revenue Cost of goods sold Selling expenses Administrative expenses Income tax expense Net
Step by Step Solution
There are 3 Steps involved in it
Step: 1

Get Instant Access to Expert-Tailored Solutions
See step-by-step solutions with expert insights and AI powered tools for academic success
Step: 2

Step: 3
Ace Your Homework with AI
Get the answers you need in no time with our AI-driven, step-by-step assistance
Get Started
How To Win Your Tax Audit An Insider Guide To Successfully Negotiating With The IRS Chronicled From The Files From The Files Of The Nations Most Successful And Respected Taxpayers Rights Advocate
Authors: Daniel J Pilla
1st Edition
1884367097, 978-1884367090