

Answered step by step
Verified Expert Solution
Question
1 Approved Answer
__PRESENT 10. (8 points) Below, the graph on the left shows the short-run cost curves for a firm in a perfectly competitive market, and the
__PRESENT
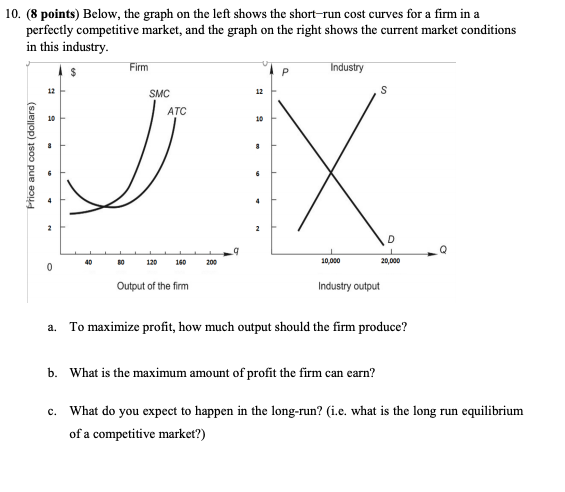
10. (8 points) Below, the graph on the left shows the short-run cost curves for a firm in a perfectly competitive market, and the graph on the right shows the current market conditions in this industry. Industry Firm 12 12 S SMC ATC 10 10 8 6 2 D 9 40 30 120 160 200 0 10.000 20,000 Output of the firm Industry output a. To maximize profit, how much output should the firm produce? b. What is the maximum amount of profit the firm can earn? c. What do you expect to happen in the long-run? (i.e. what is the long run equilibrium of a competitive market?)Step by Step Solution
There are 3 Steps involved in it
Step: 1

Get Instant Access to Expert-Tailored Solutions
See step-by-step solutions with expert insights and AI powered tools for academic success
Step: 2

Step: 3
Ace Your Homework with AI
Get the answers you need in no time with our AI-driven, step-by-step assistance
Get Started
They See Me Closin They Hatin
Authors: Be Mi Real Estate Store
1st Edition
B0BW2ZSLY1