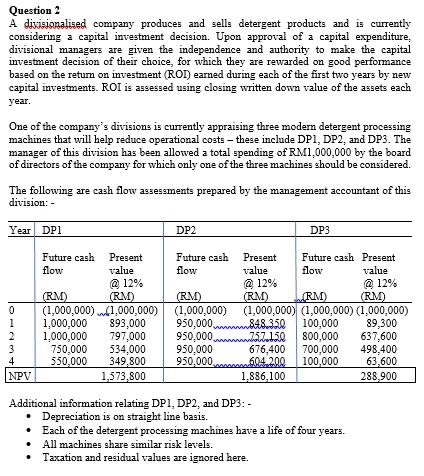
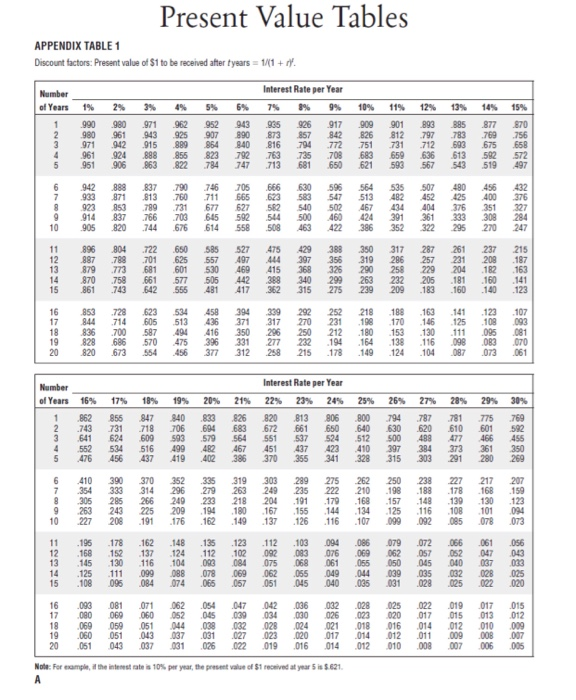
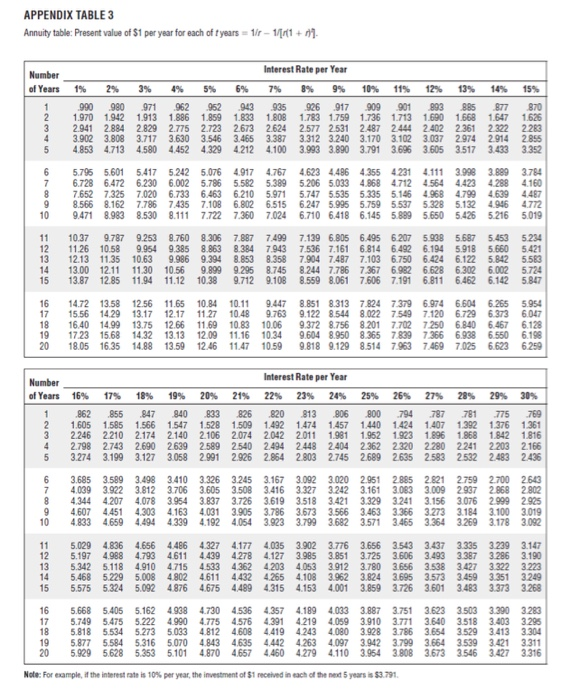
Question 2 A divisionalised company produces and sells detergent products and is currently considering a capital investment decision. Upon approval of a capital expenditure, divisional managers are given the independence and authority to make the capital investment decision of their choice for which they are rewarded on good performance based on the return on investment (ROI) earned during each of the first two years by new capital investments. ROI is assessed using closing written down value of the assets each year. One of the company's divisions is currently appraising three modern detergent processing machines that will help reduce operational costs these include DPI, DP2, and DP3. The manager of this division has been allowed a total spending of RM1,000,000 by the board of directors of the company for which only one of the three machines should be considered. The following are cash flow assessments prepared by the management accountant of this division: - Year DPI DP2 DP3 0 Future cash Present flow value @ 12% (RM) (RM) (1,000,000) 1,000,000) 1,000,000 893,000 1,000,000 797,000 750,000 534,000 550.000 349,800 1,573,800 Future cash Present Future cash Present flow value flow value @ 12% @ 12% (RM) (RM) (RM) (RM) (1,000,000) (1,000,000) (1,000.000) (1,000,000) 950,000 848.350 100,000 89,300 950,000 757 150 800,000 637,600 950,000 676,400 700,000 498,400 950,000 ...604 200 100,000 63,600 1,886,100 288,900 1 2 3 4 NPV Additional information relating DP1, DP2, and DP3: - Depreciation is on straight line basis. Each of the detergent processing machines have a life of four years. All machines share similar risk levels. Taxation and residual values are ignored here. . Required: (a) Evaluate DP1, DP2, and DP3 from a divisional point of view. (12 marks) (b) Is there a conflict of interest between the divisional manager and the board of directors of the company regarding the choice of investment? Explain. (4 marks) c) Show and comment how residual income may be better in evaluating the divisional performance of managers at the company. (9 marks) Total: 25 Marks] 15 12 25% 11 10 25% Value Tables Present Interest Rate per Year 2 Interest Rate per Year 23% 22 7 6s 21% | | Note: For comple, if the interest rate is 10% per year, the present value of $1 received at year is 5.621 A Discount factors: Present value of $1 to be received after tyears = 1/(1+1 APPENDIX TABLE 1 | 2 17 | 3 ) | 15 Number of Years on IN 1 of Years Number GRUN TA 15 16 10 19 APPENDIX TABLE 3 Annuity table: Present value of $1 per year for each of t years = 1/2 - 1/11 + n). Number of Years 3% 9% 13% 15% 1 3 2 Interest Rate per Year 1% 5% 6% 10% 12% 14% 990 .980 971 962 952 .943 935 926 917 909 901 .893 885 877 1.970 1.942 1.913 1.886 1.859 1.833 1.80B 1.783 1.759 1.736 1713 1.690 1.668 1.647 2.941 2.884 2.829 2.775 2.723 2.673 2.624 2.577 2.531 2.487 2444 2.402 2.361 2.322 3.902 3.808 3.717 3.630 3.546 3.465 3.387 3.312 3.240 3.170 3.102 3.037 2.974 2914 4.853 4.713 4.580 4.452 4.329 4212 4.100 3.993 3.890 3.791 3.696 3.605 3.517 3.433 5.795 5.601 5.417 5.242 5.076 4.917 4.767 4.623 4496 4.355 4231 4.111 3.9983.889 6.728 6.472 6.230 6.002 5.786 5.582 5.389 5.206 5.033 4.868 4.712 4.564 4423 4.288 7.652 7.325 7.020 6.733 6.463 6.210 5.971 5.747 5.535 5.335 5.146 4.968 4.799 4.639 8.566 8.162 7.786 7.435 7.108 6.802 6.515 6.247 5.995 5.759 5.537 5.328 5.132 4.946 9.471 8.983 8.530 8.111 7.722 7.360 7.024 6.710 6.418 6.145 5.889 5.650 5.426 5.216 870 1.626 2283 2855 3.352 4 5 6 7 8 9 10 3.784 4160 4487 4.772 5.019 11 12 13 14 15 10.37 9.787 9.253 8.760 8.306 7.887 7.499 7.139 6.805 6.495 6.207 5.938 5.687 5.453 11.26 10.58 9.954 9.385 8.863 8.384 7.943 7.536 7.161 6.814 6.492 6.194 5,918 5.660 12.13 11.35 10.63 9.986 9.394 8.853 8.358 7.904 7.487 7.103 6.750 6.424 6.122 5.842 13.00 12.11 11.30 10.56 9.899 9.295 8.745 8.244 7.786 7.367 6.982 6.628 6.302 6.002 13.87 12.85 11.94 11.12 10.38 9.712 9.108 8.559 8.061 7.606 7.1916.811 6.462 6.142 5.234 5.421 5.583 5.724 5.847 16 17 18 19 20 14.72 13.58 12.56 11.65 10.84 15.56 14.29 13.17 12.17 11.27 16.40 14.99 13.75 12.66 11.69 17.23 15.68 14.32 13.13 12.09 18.05 16.35 14.88 13.59 12.46 10.11 9.447 8.851 8.313 7.824 7.379 6.974 6.604 6.265 10.48 9.763 9.122 8.544 8.022 7.549 7.120 6.7296.373 10.83 10.06 9.372 8.756 8.2017.702 7.250 6.840 6.467 11.16 10.34 9.604 8.950 8.365 7.839 7366 6.938 6.550 11.47 10.59 9.818 9.129 8.514 7.963 7.469 7025 6.623 5.954 6.047 6128 6.198 6.250 1 Number Interest Rate per Year of Years 16% 17% 18% 19% 20% 21% 22% 23% 24% 25% 26% 27% 28% 29% 30% .862 .855 847 840 833 826 820 813 .806 800 .794 .787 781 775 .769 2. 1.605 1.585 1.566 1.547 1.528 1.509 1.492 1.474 1.457 1.440 1.424 1.407 1.392 1.376 1361 3 2.246 2.210 2.174 2.140 2.106 2.074 2.042 2.011 1.981 1.952 1.923 1.896 1.868 1.842 1.816 4 2.798 2.743 2.690 2639 2.589 2540 2.494 2.448 2.404 2.362 2320 2.280 2241 2 203 2.166 5 3.274 3.1993.127 3.058 2.991 2.926 2854 2.803 2.745 2.689 2635 2583 2532 24832436 6 7 8 9 10 3.685 3.589 3.498 3.410 3.326 3245 3.167 3.092 3.020 2.951 2.885 2.821 2.759 2.700 2.643 4.039 3.922 3.812 3.706 3.605 3.508 3.416 3.327 3.242 3.161 3.083 3.009 2.937 2.868 2.802 4.344 4.207 4.078 3.954 3.837 3.726 3.619 3.518 3.421 3.329 3.241 3.156 3.076 2.999 2.925 4.607 4.451 4.303 4.163 4.031 3.905 3.786 3.673 3.566 3.463 3.366 3.273 3.184 3.100 3.019 4.833 4659 4494 4339 4.192 4.054 3.923 3.799 3.682 3.571 3.465 3.364 3.269 3.178 3.092 11 12 13 14 15 5.0294.836 4.656 4.486 4.327 4177 4.035 3.902 3.776 3.656 3.543 3.437 3.335 3.239 3.147 5.197 4.988 4.793 4.611 4.439 4.278 4.127 3.985 3.851 3.725 3.606 3.493 3.387 3.286 3.190 5.342 5.118 4.910 4.715 4.533 4.3624.203 4.053 3.912 3.780 3.656 3.538 3.427 3.322 3223 5.468 5.229 5.008 4.802 4.611 4432 4.265 4.108 3.962 3.824 3.695 3.573 3.459 3.351 3.249 5.575 5.324 5.092 4.876 4.675 4.489 4.315 4.153 4.001 3.859 3.726 3.601 3.483 3.373 3.268 5.668 5.405 5.162 4.938 4.730 4.536 4.357 4.189 4.033 3.887 3.751 3.623 3.503 3.390 3.283 5.749 5.475 5.222 4.990 4.775 4.576 4.391 4219 4.059 3.910 3.771 3.640 3.518 3.403 3.295 5.818 5.534 5.273 5.033 4.812 4.608 4.419 4.243 4.080 3.928 3.786 3.654 3.529 3.413 3.304 5.877 5.584 5.316 5.070 4.843 4.635 4.442 4.263 4.097 3.942 3.799 3.664 3.539 3.421 3.311 5.929 5.628 5.353 5.101 4.870 4.657 4.460 4.279 4.110 3.954 3.808 3.673 3.546 3.427 3.316 16 17 18 19 20 Note: For example, if the interest rate is 10% per year, the investment of $1 received in each of the next 5 years is $3.791. Question 2 A divisionalised company produces and sells detergent products and is currently considering a capital investment decision. Upon approval of a capital expenditure, divisional managers are given the independence and authority to make the capital investment decision of their choice for which they are rewarded on good performance based on the return on investment (ROI) earned during each of the first two years by new capital investments. ROI is assessed using closing written down value of the assets each year. One of the company's divisions is currently appraising three modern detergent processing machines that will help reduce operational costs these include DPI, DP2, and DP3. The manager of this division has been allowed a total spending of RM1,000,000 by the board of directors of the company for which only one of the three machines should be considered. The following are cash flow assessments prepared by the management accountant of this division: - Year DPI DP2 DP3 0 Future cash Present flow value @ 12% (RM) (RM) (1,000,000) 1,000,000) 1,000,000 893,000 1,000,000 797,000 750,000 534,000 550.000 349,800 1,573,800 Future cash Present Future cash Present flow value flow value @ 12% @ 12% (RM) (RM) (RM) (RM) (1,000,000) (1,000,000) (1,000.000) (1,000,000) 950,000 848.350 100,000 89,300 950,000 757 150 800,000 637,600 950,000 676,400 700,000 498,400 950,000 ...604 200 100,000 63,600 1,886,100 288,900 1 2 3 4 NPV Additional information relating DP1, DP2, and DP3: - Depreciation is on straight line basis. Each of the detergent processing machines have a life of four years. All machines share similar risk levels. Taxation and residual values are ignored here. . Required: (a) Evaluate DP1, DP2, and DP3 from a divisional point of view. (12 marks) (b) Is there a conflict of interest between the divisional manager and the board of directors of the company regarding the choice of investment? Explain. (4 marks) c) Show and comment how residual income may be better in evaluating the divisional performance of managers at the company. (9 marks) Total: 25 Marks] 15 12 25% 11 10 25% Value Tables Present Interest Rate per Year 2 Interest Rate per Year 23% 22 7 6s 21% | | Note: For comple, if the interest rate is 10% per year, the present value of $1 received at year is 5.621 A Discount factors: Present value of $1 to be received after tyears = 1/(1+1 APPENDIX TABLE 1 | 2 17 | 3 ) | 15 Number of Years on IN 1 of Years Number GRUN TA 15 16 10 19 APPENDIX TABLE 3 Annuity table: Present value of $1 per year for each of t years = 1/2 - 1/11 + n). Number of Years 3% 9% 13% 15% 1 3 2 Interest Rate per Year 1% 5% 6% 10% 12% 14% 990 .980 971 962 952 .943 935 926 917 909 901 .893 885 877 1.970 1.942 1.913 1.886 1.859 1.833 1.80B 1.783 1.759 1.736 1713 1.690 1.668 1.647 2.941 2.884 2.829 2.775 2.723 2.673 2.624 2.577 2.531 2.487 2444 2.402 2.361 2.322 3.902 3.808 3.717 3.630 3.546 3.465 3.387 3.312 3.240 3.170 3.102 3.037 2.974 2914 4.853 4.713 4.580 4.452 4.329 4212 4.100 3.993 3.890 3.791 3.696 3.605 3.517 3.433 5.795 5.601 5.417 5.242 5.076 4.917 4.767 4.623 4496 4.355 4231 4.111 3.9983.889 6.728 6.472 6.230 6.002 5.786 5.582 5.389 5.206 5.033 4.868 4.712 4.564 4423 4.288 7.652 7.325 7.020 6.733 6.463 6.210 5.971 5.747 5.535 5.335 5.146 4.968 4.799 4.639 8.566 8.162 7.786 7.435 7.108 6.802 6.515 6.247 5.995 5.759 5.537 5.328 5.132 4.946 9.471 8.983 8.530 8.111 7.722 7.360 7.024 6.710 6.418 6.145 5.889 5.650 5.426 5.216 870 1.626 2283 2855 3.352 4 5 6 7 8 9 10 3.784 4160 4487 4.772 5.019 11 12 13 14 15 10.37 9.787 9.253 8.760 8.306 7.887 7.499 7.139 6.805 6.495 6.207 5.938 5.687 5.453 11.26 10.58 9.954 9.385 8.863 8.384 7.943 7.536 7.161 6.814 6.492 6.194 5,918 5.660 12.13 11.35 10.63 9.986 9.394 8.853 8.358 7.904 7.487 7.103 6.750 6.424 6.122 5.842 13.00 12.11 11.30 10.56 9.899 9.295 8.745 8.244 7.786 7.367 6.982 6.628 6.302 6.002 13.87 12.85 11.94 11.12 10.38 9.712 9.108 8.559 8.061 7.606 7.1916.811 6.462 6.142 5.234 5.421 5.583 5.724 5.847 16 17 18 19 20 14.72 13.58 12.56 11.65 10.84 15.56 14.29 13.17 12.17 11.27 16.40 14.99 13.75 12.66 11.69 17.23 15.68 14.32 13.13 12.09 18.05 16.35 14.88 13.59 12.46 10.11 9.447 8.851 8.313 7.824 7.379 6.974 6.604 6.265 10.48 9.763 9.122 8.544 8.022 7.549 7.120 6.7296.373 10.83 10.06 9.372 8.756 8.2017.702 7.250 6.840 6.467 11.16 10.34 9.604 8.950 8.365 7.839 7366 6.938 6.550 11.47 10.59 9.818 9.129 8.514 7.963 7.469 7025 6.623 5.954 6.047 6128 6.198 6.250 1 Number Interest Rate per Year of Years 16% 17% 18% 19% 20% 21% 22% 23% 24% 25% 26% 27% 28% 29% 30% .862 .855 847 840 833 826 820 813 .806 800 .794 .787 781 775 .769 2. 1.605 1.585 1.566 1.547 1.528 1.509 1.492 1.474 1.457 1.440 1.424 1.407 1.392 1.376 1361 3 2.246 2.210 2.174 2.140 2.106 2.074 2.042 2.011 1.981 1.952 1.923 1.896 1.868 1.842 1.816 4 2.798 2.743 2.690 2639 2.589 2540 2.494 2.448 2.404 2.362 2320 2.280 2241 2 203 2.166 5 3.274 3.1993.127 3.058 2.991 2.926 2854 2.803 2.745 2.689 2635 2583 2532 24832436 6 7 8 9 10 3.685 3.589 3.498 3.410 3.326 3245 3.167 3.092 3.020 2.951 2.885 2.821 2.759 2.700 2.643 4.039 3.922 3.812 3.706 3.605 3.508 3.416 3.327 3.242 3.161 3.083 3.009 2.937 2.868 2.802 4.344 4.207 4.078 3.954 3.837 3.726 3.619 3.518 3.421 3.329 3.241 3.156 3.076 2.999 2.925 4.607 4.451 4.303 4.163 4.031 3.905 3.786 3.673 3.566 3.463 3.366 3.273 3.184 3.100 3.019 4.833 4659 4494 4339 4.192 4.054 3.923 3.799 3.682 3.571 3.465 3.364 3.269 3.178 3.092 11 12 13 14 15 5.0294.836 4.656 4.486 4.327 4177 4.035 3.902 3.776 3.656 3.543 3.437 3.335 3.239 3.147 5.197 4.988 4.793 4.611 4.439 4.278 4.127 3.985 3.851 3.725 3.606 3.493 3.387 3.286 3.190 5.342 5.118 4.910 4.715 4.533 4.3624.203 4.053 3.912 3.780 3.656 3.538 3.427 3.322 3223 5.468 5.229 5.008 4.802 4.611 4432 4.265 4.108 3.962 3.824 3.695 3.573 3.459 3.351 3.249 5.575 5.324 5.092 4.876 4.675 4.489 4.315 4.153 4.001 3.859 3.726 3.601 3.483 3.373 3.268 5.668 5.405 5.162 4.938 4.730 4.536 4.357 4.189 4.033 3.887 3.751 3.623 3.503 3.390 3.283 5.749 5.475 5.222 4.990 4.775 4.576 4.391 4219 4.059 3.910 3.771 3.640 3.518 3.403 3.295 5.818 5.534 5.273 5.033 4.812 4.608 4.419 4.243 4.080 3.928 3.786 3.654 3.529 3.413 3.304 5.877 5.584 5.316 5.070 4.843 4.635 4.442 4.263 4.097 3.942 3.799 3.664 3.539 3.421 3.311 5.929 5.628 5.353 5.101 4.870 4.657 4.460 4.279 4.110 3.954 3.808 3.673 3.546 3.427 3.316 16 17 18 19 20 Note: For example, if the interest rate is 10% per year, the investment of $1 received in each of the next 5 years is $3.791


