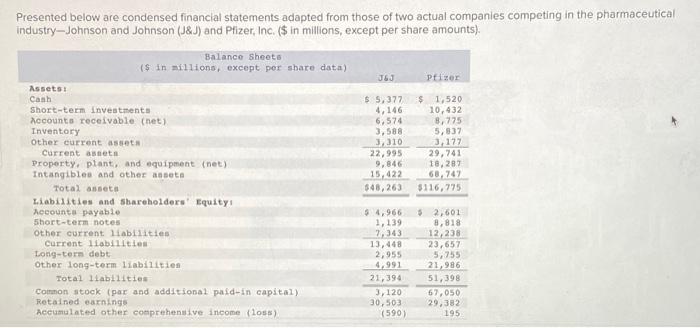
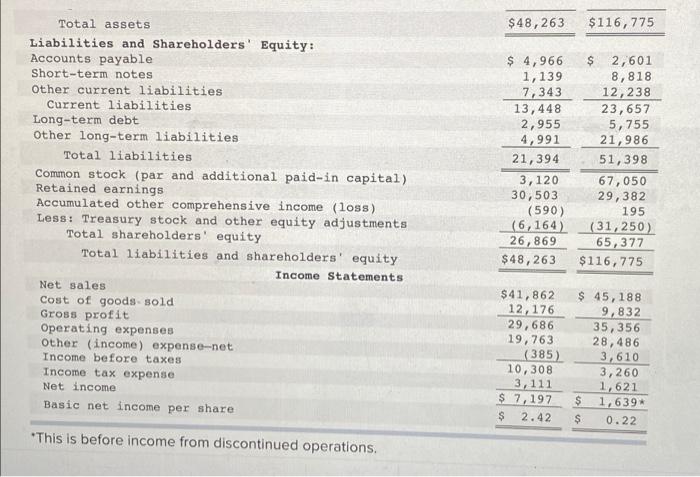
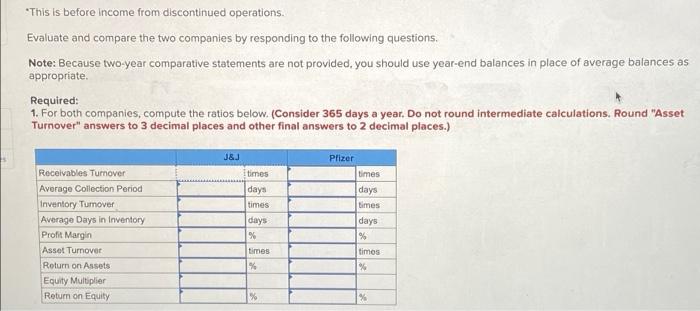
Presented below are condensed financial statements adapted from those of two actual companies competing in the pharmaceutical industry-Johnson and Johnson (J&J) and Pfizer, Inc. ($ in millions, except per share amounts). Balance Sheets ($ in millions, except per sbare data) J&J Pfizer Assets Canh $ 5,377 $ 1,520 Short-term investments 4,146 10,432 Accounts receivable (net) 6,574 8,775 Inventory 3,588 5,937 Other current asset J310 3,177 Current asset 22,995 29,741 Property, plant, and equipment (net) 9,846 18,287 Intangibles and other anseta 15,422 68,74% Total asseta $48,263 $116,725 Liabilities and Shareholders' Equity Accounts payable 54,966 $ 2,601 short-term notes 1,139 8,818 Other current liabilities 2,343 12,238 Current liabilities 13,468 23,657 Long-term debt 2,955 5,755 Other long-term liabilities 4.991 21,986 Total liabilities 21,394 51,398 Common stock par and additional paid-in capital) 3,120 67,050 Retained earnings 30,503 29.382 Accumulated other comprehensive income (los) (590) 195 $48,263 $116, 775 Total assets Liabilities and Shareholders' Equity: Accounts payable Short-term notes Other current liabilities Current liabilities Long-term debt Other long-term liabilities Total liabilities Common stock (par and additional paid-in capital) Retained earnings Accumulated other comprehensive income (loss) Less: Treasury stock and other equity adjustments Total shareholders' equity Total liabilities and shareholders' equity Income Statements Net sales Cost of goods sold Gross profit Operating expenses Other (income) expense-net Income before taxes Income tax expense Net income Basic net income per share $ 4,966 1,139 7,343 13,448 2,955 4,991 21,394 3,120 30,503 (590) (6,164) 26,869 $48,263 $ 2,601 8,818 12,238 23,657 5,755 21,986 51,398 67,050 29,382 195 (31,250) 65, 377 $116,775 $41,862 12,176 29,686 19,763 (385) 10,308 3,111 $ 7,197 $ 2.42 $ 45,188 9,832 35, 356 28,486 3,610 3,260 1,621 $ 1,639* $ 0.22 *This is before income from discontinued operations, *This is before income from discontinued operations. Evaluate and compare the two companies by responding to the following questions. Note: Because two-year comparative statements are not provided, you should use year-end balances in place of average balances as appropriate Required: 1. For both companies, compute the ratios below. (Consider 365 days a year. Do not round intermediate calculations. Round "Asset Turnover" answers to 3 decimal places and other final answers to 2 decimal places.) J&J Receivables Turnover Average Collection Period Inventory Tumover Average Days in Inventory Profit Margin Asset Turnover Return on Assets Equity Multiplier Return on Equity times days times days % Pfizer times days times days % timos % times % % %