Answered step by step
Verified Expert Solution
Question
1 Approved Answer
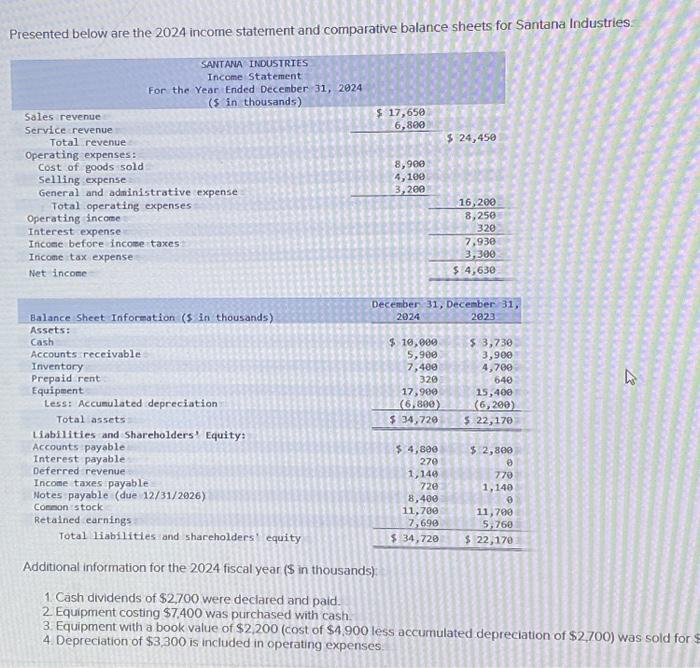
Presented below are the 2024 income statement and comparative balance sheets for Santana Industries. Sales revenue Service revenue Total revenue Operating expenses: Cost of goods
Presented below are the 2024 income statement and comparative balance sheets for Santana Industries. Sales revenue Service revenue Total revenue Operating expenses: Cost of goods sold For the Year Ended December 31, 2024 ($ in thousands) SANTANA INDUSTRIES Income Statement Selling expense General and administrative expense Total operating expenses Operating income Interest expense Income before income taxes Income tax expense Net income Balance Sheet Information ($ in thousands) Assets: Cash Accounts receivable Inventory Prepaid rent Equipment Less: Accumulated depreciation Total assets. Liabilities and Shareholders' Equity: Accounts payable Interest payable Deferred revenue $ 17,650 6,800 8,900 4,100 3,200 $ 10,000 5,900 7,400 320 17,900 (6,800) $ 34,720 $ 24,450 December 31, December 31, 2024 2023 $ 4,800 270 1,140 720 8,400 11,700 7,690 $34,720 16,200 3,250 320 7,930 3,300 $ 4,630 $ 3,730 3,900 4,700 640 15,400 (6,200) $ 22,170 $ 2,800 0 770 1,140 0 D Income taxes payable Notes payable (due 12/31/2026) Common stock Retained earnings Total liabilities and shareholders equity Additional information for the 2024 fiscal year ($ in thousands): 1. Cash dividends of $2,700 we declared and paid. 2. Equipment costing $7,400 was purchased with cash. 3. Equipment with a book value of $2,200 (cost of $4,900 less accumulated depreciation of $2,700) was sold for $ 4. Depreciation of $3,300 is included in operating expenses. 11,700 5,760 $ 22,170


Step by Step Solution
There are 3 Steps involved in it
Step: 1

Get Instant Access to Expert-Tailored Solutions
See step-by-step solutions with expert insights and AI powered tools for academic success
Step: 2

Step: 3

Ace Your Homework with AI
Get the answers you need in no time with our AI-driven, step-by-step assistance
Get Started


