Answered step by step
Verified Expert Solution
Link Copied!

Question

1 Approved Answer

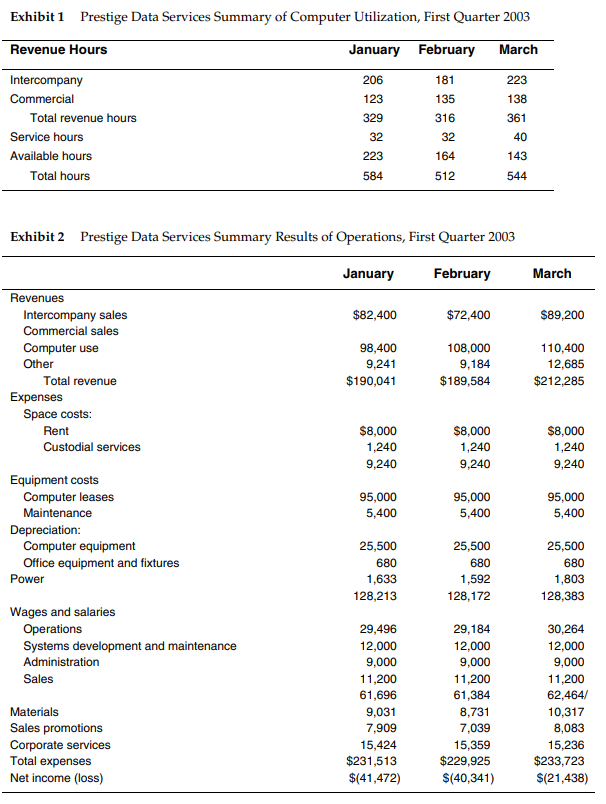
Prestige Data Services Estimate the variable cost per cost driver and the fixed cost per month. Develop formulas to express the cost behavior for each

Prestige Data Services

  1. Estimate the variable cost per cost driver and the fixed cost per month. Develop formulas to express the cost behavior for each cost item.

image text in transcribed

Exhibit 1 Prestige Data Services Summary of Computer Utilization, First Quarter 2003 Revenue Hours January February March 223 138 Intercompany Commercial Total revenue hours Service hours Available hours Total hours 206 123 329 32 223 584 181 135 316 32 361 40 143 164 512 544 Exhibit 2 Prestige Data Services Summary Results of Operations, First Quarter 2003 January February March $82,400 $72,400 $89,200 Revenues Intercompany sales Commercial sales Computer use Other Total revenue Expenses Space costs: Rent Custodial services 98,400 9,241 $190,041 108,000 9,184 $189,584 110,400 12,685 $212,285 $8,000 1,240 9,240 $8,000 1,240 9,240 $8,000 1,240 9,240 95,000 5,400 95,000 5,400 95,000 5,400 Equipment costs Computer leases Maintenance Depreciation: Computer equipment Office equipment and fixtures Power 25,500 680 1,633 128,213 25,500 680 1,592 128,172 25,500 680 1,803 128,383 Wages and salaries Operations Systems development and maintenance Administration Sales Materials Sales promotions Corporate services Total expenses Net income (loss) 29,496 12,000 9,000 11,200 61,696 9,031 7,909 15,424 $231,513 $(41,472) 29,184 12,000 9,000 11,200 61,384 8,731 7,039 15,359 $229,925 $(40,341) 30,264 12,000 9,000 11,200 62,464/ 10,317 8,083 15,236 $233,723 $(21,438) Exhibit 1 Prestige Data Services Summary of Computer Utilization, First Quarter 2003 Revenue Hours January February March 223 138 Intercompany Commercial Total revenue hours Service hours Available hours Total hours 206 123 329 32 223 584 181 135 316 32 361 40 143 164 512 544 Exhibit 2 Prestige Data Services Summary Results of Operations, First Quarter 2003 January February March $82,400 $72,400 $89,200 Revenues Intercompany sales Commercial sales Computer use Other Total revenue Expenses Space costs: Rent Custodial services 98,400 9,241 $190,041 108,000 9,184 $189,584 110,400 12,685 $212,285 $8,000 1,240 9,240 $8,000 1,240 9,240 $8,000 1,240 9,240 95,000 5,400 95,000 5,400 95,000 5,400 Equipment costs Computer leases Maintenance Depreciation: Computer equipment Office equipment and fixtures Power 25,500 680 1,633 128,213 25,500 680 1,592 128,172 25,500 680 1,803 128,383 Wages and salaries Operations Systems development and maintenance Administration Sales Materials Sales promotions Corporate services Total expenses Net income (loss) 29,496 12,000 9,000 11,200 61,696 9,031 7,909 15,424 $231,513 $(41,472) 29,184 12,000 9,000 11,200 61,384 8,731 7,039 15,359 $229,925 $(40,341) 30,264 12,000 9,000 11,200 62,464/ 10,317 8,083 15,236 $233,723 $(21,438)

Step by Step Solution

There are 3 Steps involved in it

Step: 1

blur-text-image

Get Instant Access to Expert-Tailored Solutions

See step-by-step solutions with expert insights and AI powered tools for academic success

Step: 2

blur-text-image

Step: 3

blur-text-image

Ace Your Homework with AI

Get the answers you need in no time with our AI-driven, step-by-step assistance

Get Started

Recommended Textbook for

Accounting For Non Accounting Students

Authors: John R. Dyson

7th Edition

0273709224, 9780273709220

More Books

Students also viewed these Accounting questions