Answered step by step
Verified Expert Solution
Question
1 Approved Answer
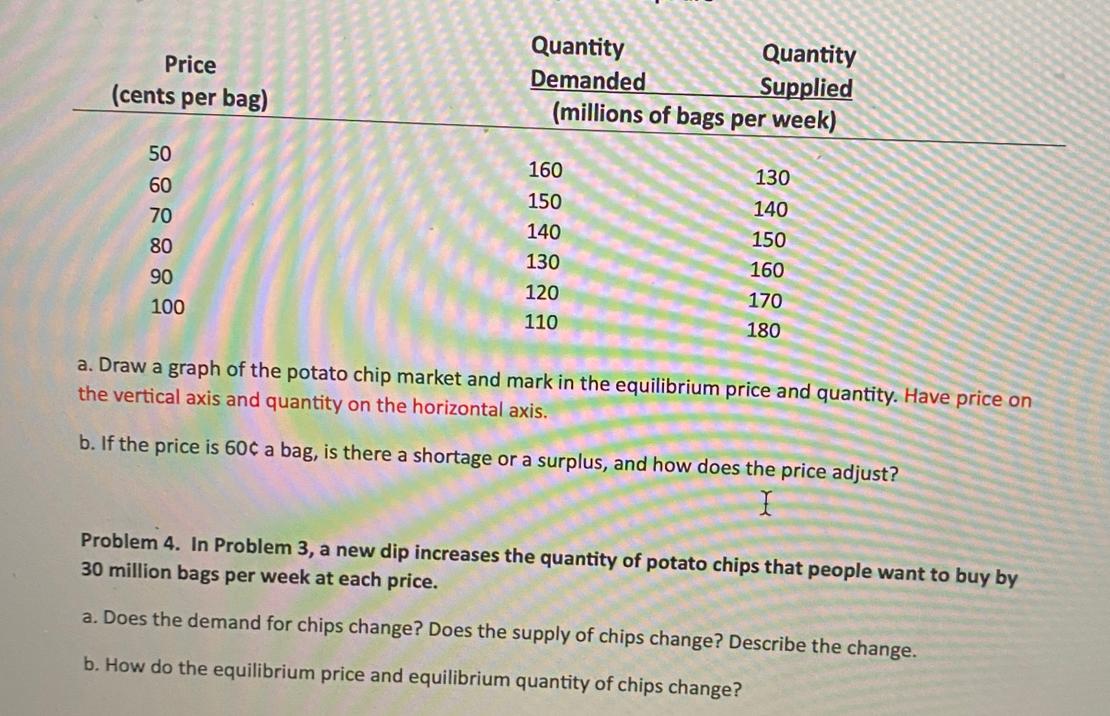
Price (cents per bag) 50 60 70 80 90 100 Quantity Demanded Quantity Supplied (millions of bags per week) 160 130 150 140 140

Price (cents per bag) 50 60 70 80 90 100 Quantity Demanded Quantity Supplied (millions of bags per week) 160 130 150 140 140 150 130 160 120 170 110 180 a. Draw a graph of the potato chip market and mark in the equilibrium price and quantity. Have price on the vertical axis and quantity on the horizontal axis. b. If the price is 60 a bag, is there a shortage or a surplus, and how does the price adjust? I Problem 4. In Problem 3, a new dip increases the quantity of potato chips that people want to buy by 30 million bags per week at each price. a. Does the demand for chips change? Does the supply of chips change? Describe the change. b. How do the equilibrium price and equilibrium quantity of chips change?
Step by Step Solution
There are 3 Steps involved in it
Step: 1
a Graph of the potato chip market Price 600 Equilibrium Price and Quantity Quantity b If the price i...
Get Instant Access to Expert-Tailored Solutions
See step-by-step solutions with expert insights and AI powered tools for academic success
Step: 2

Step: 3

Ace Your Homework with AI
Get the answers you need in no time with our AI-driven, step-by-step assistance
Get Started


