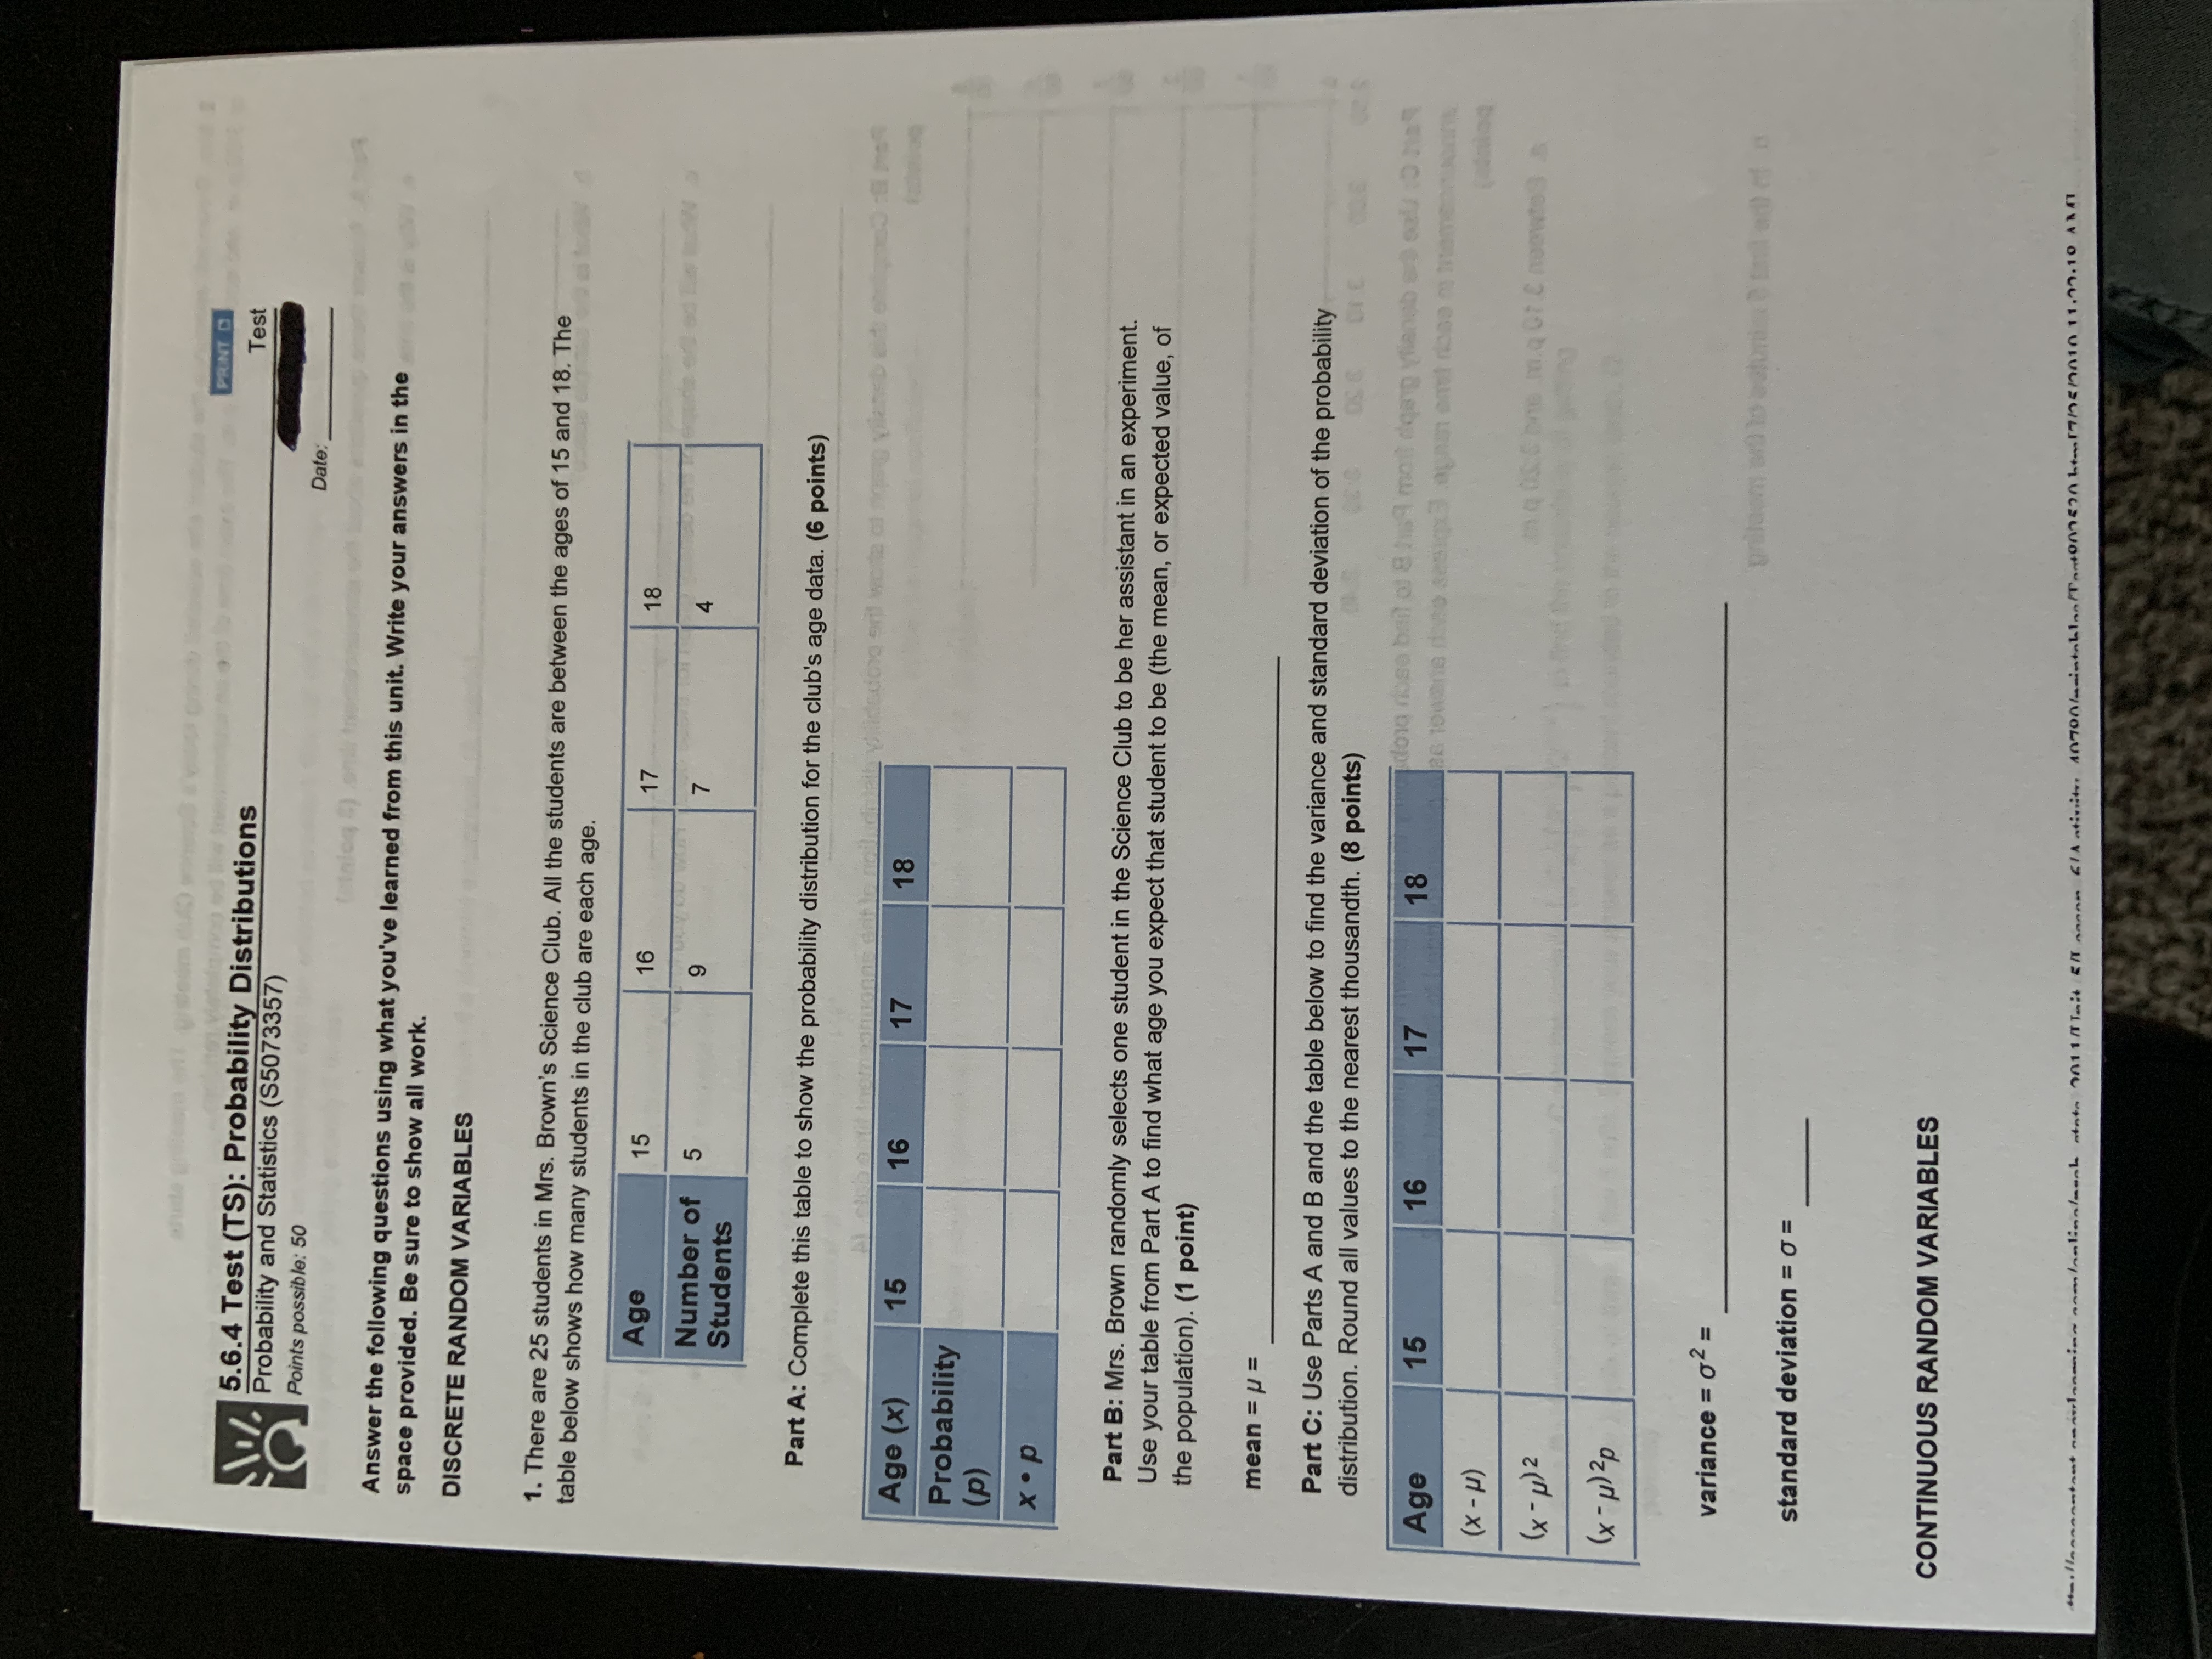
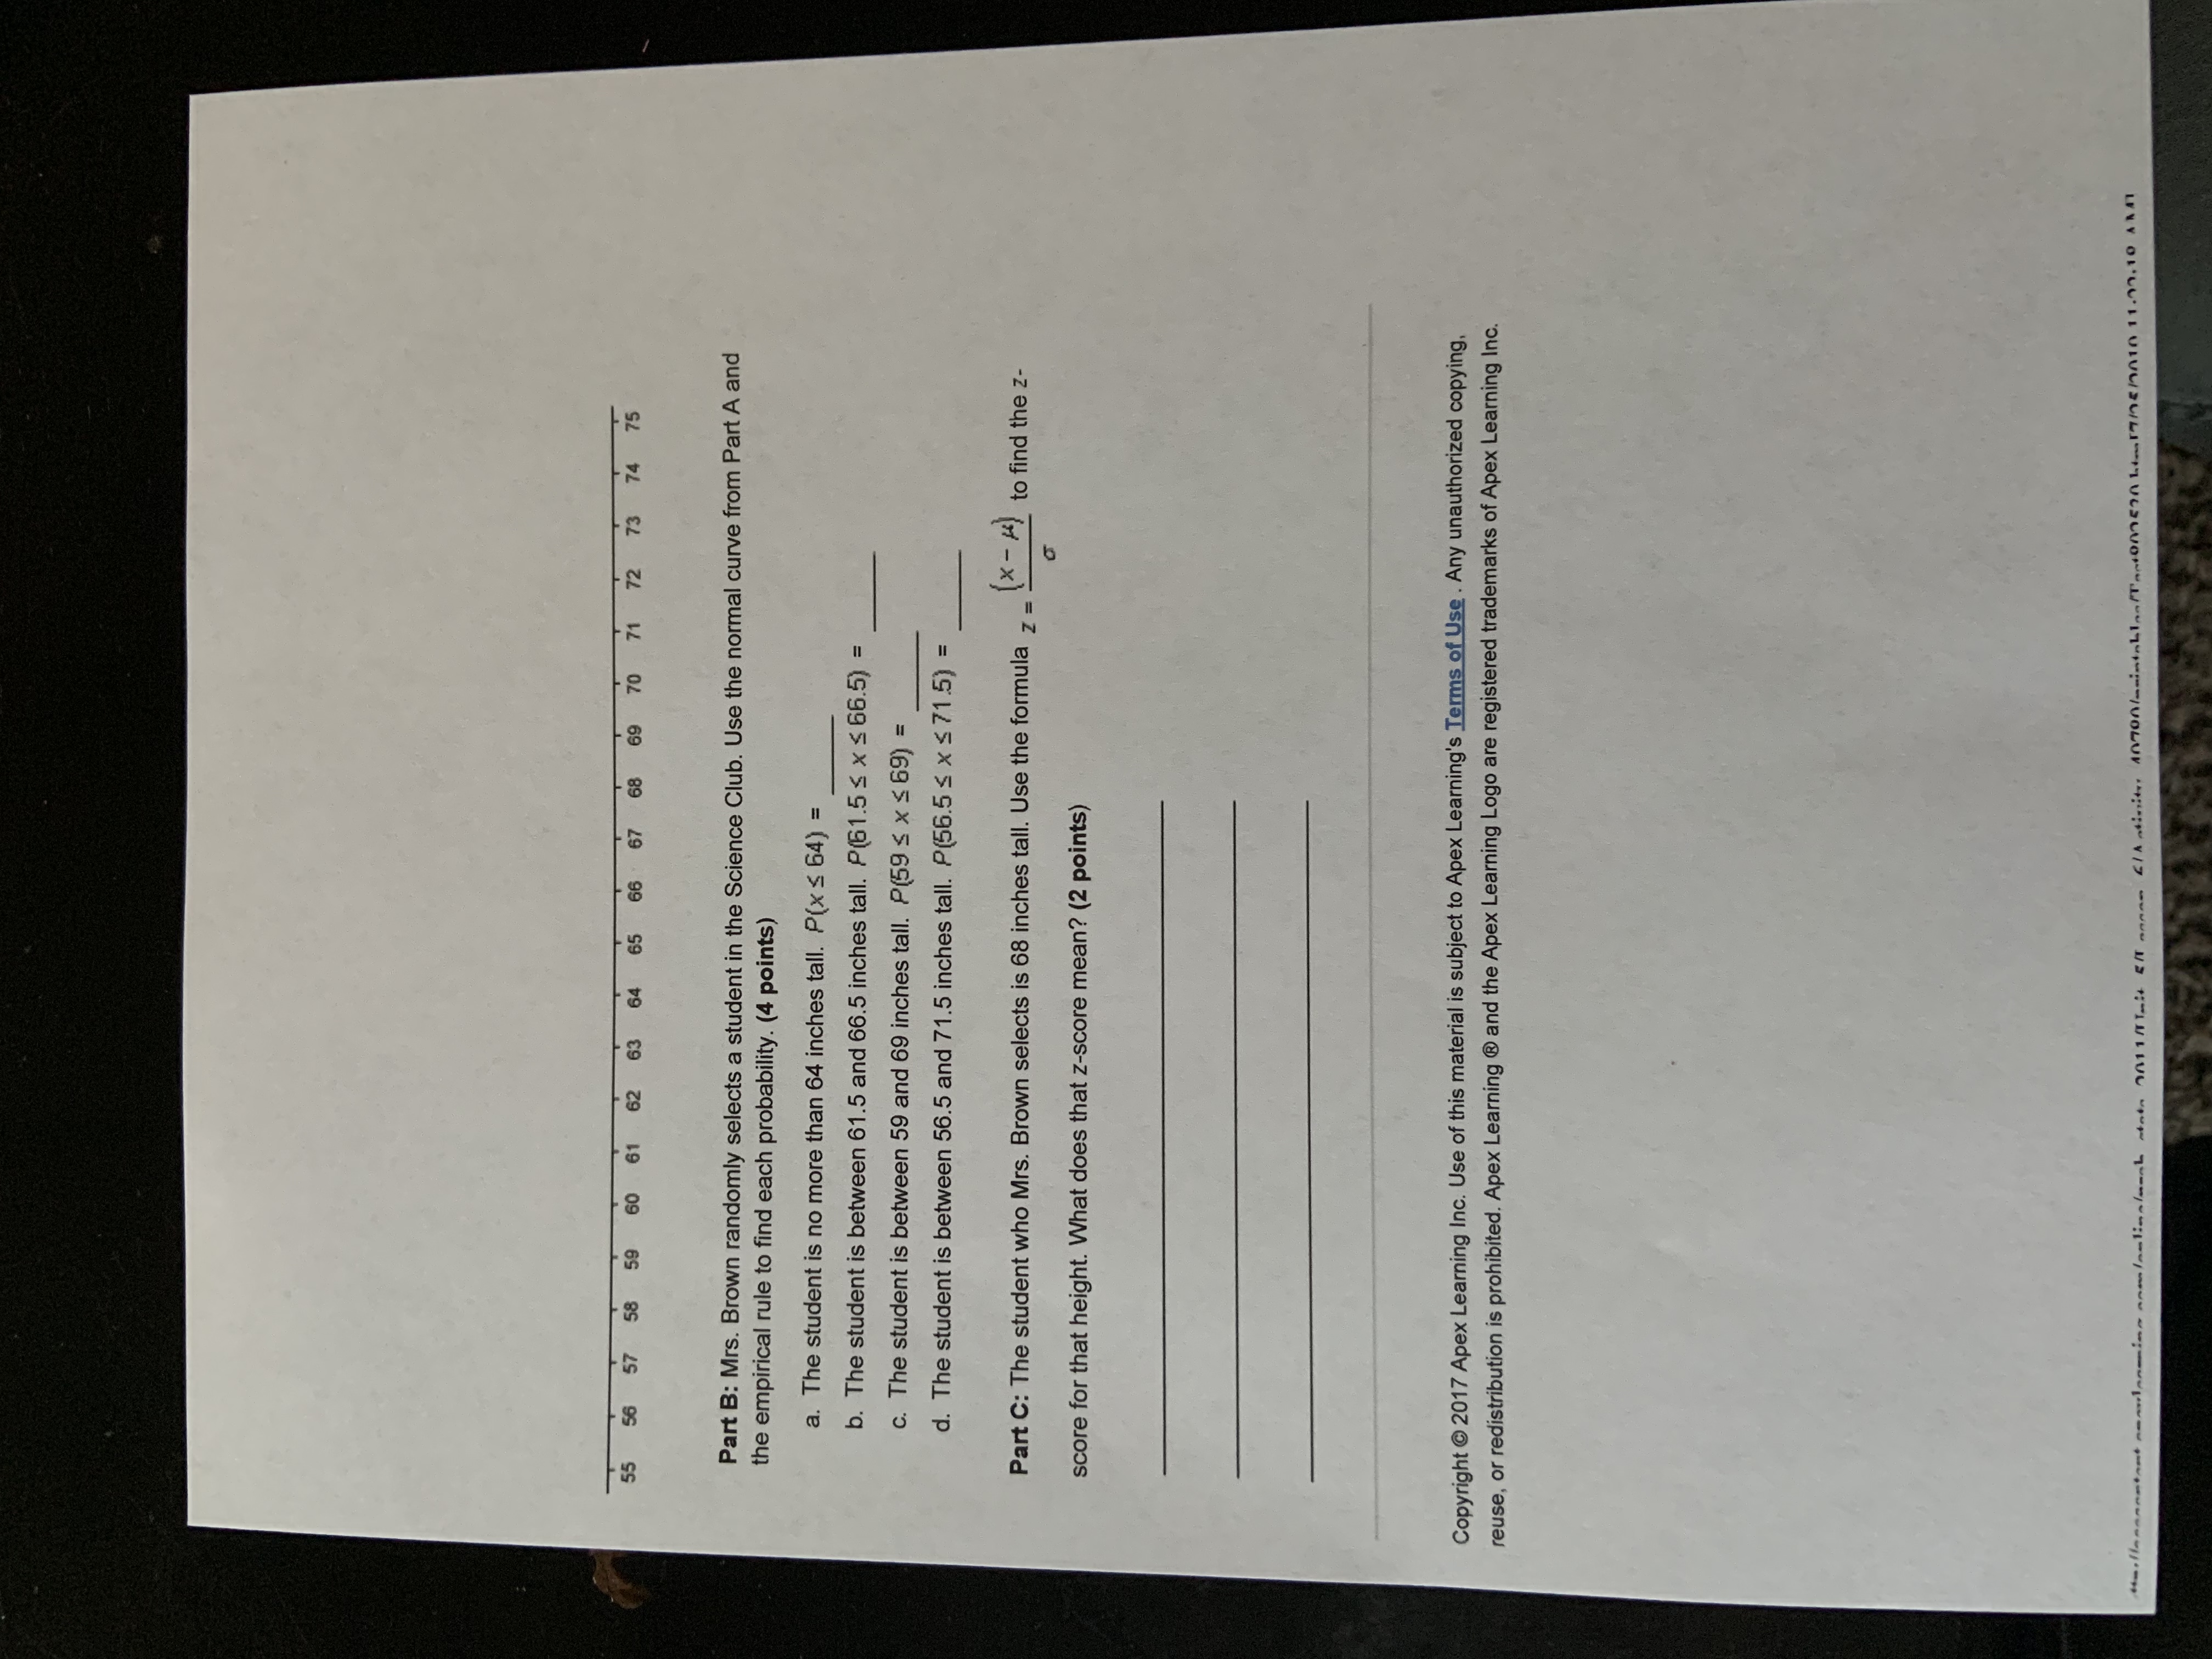
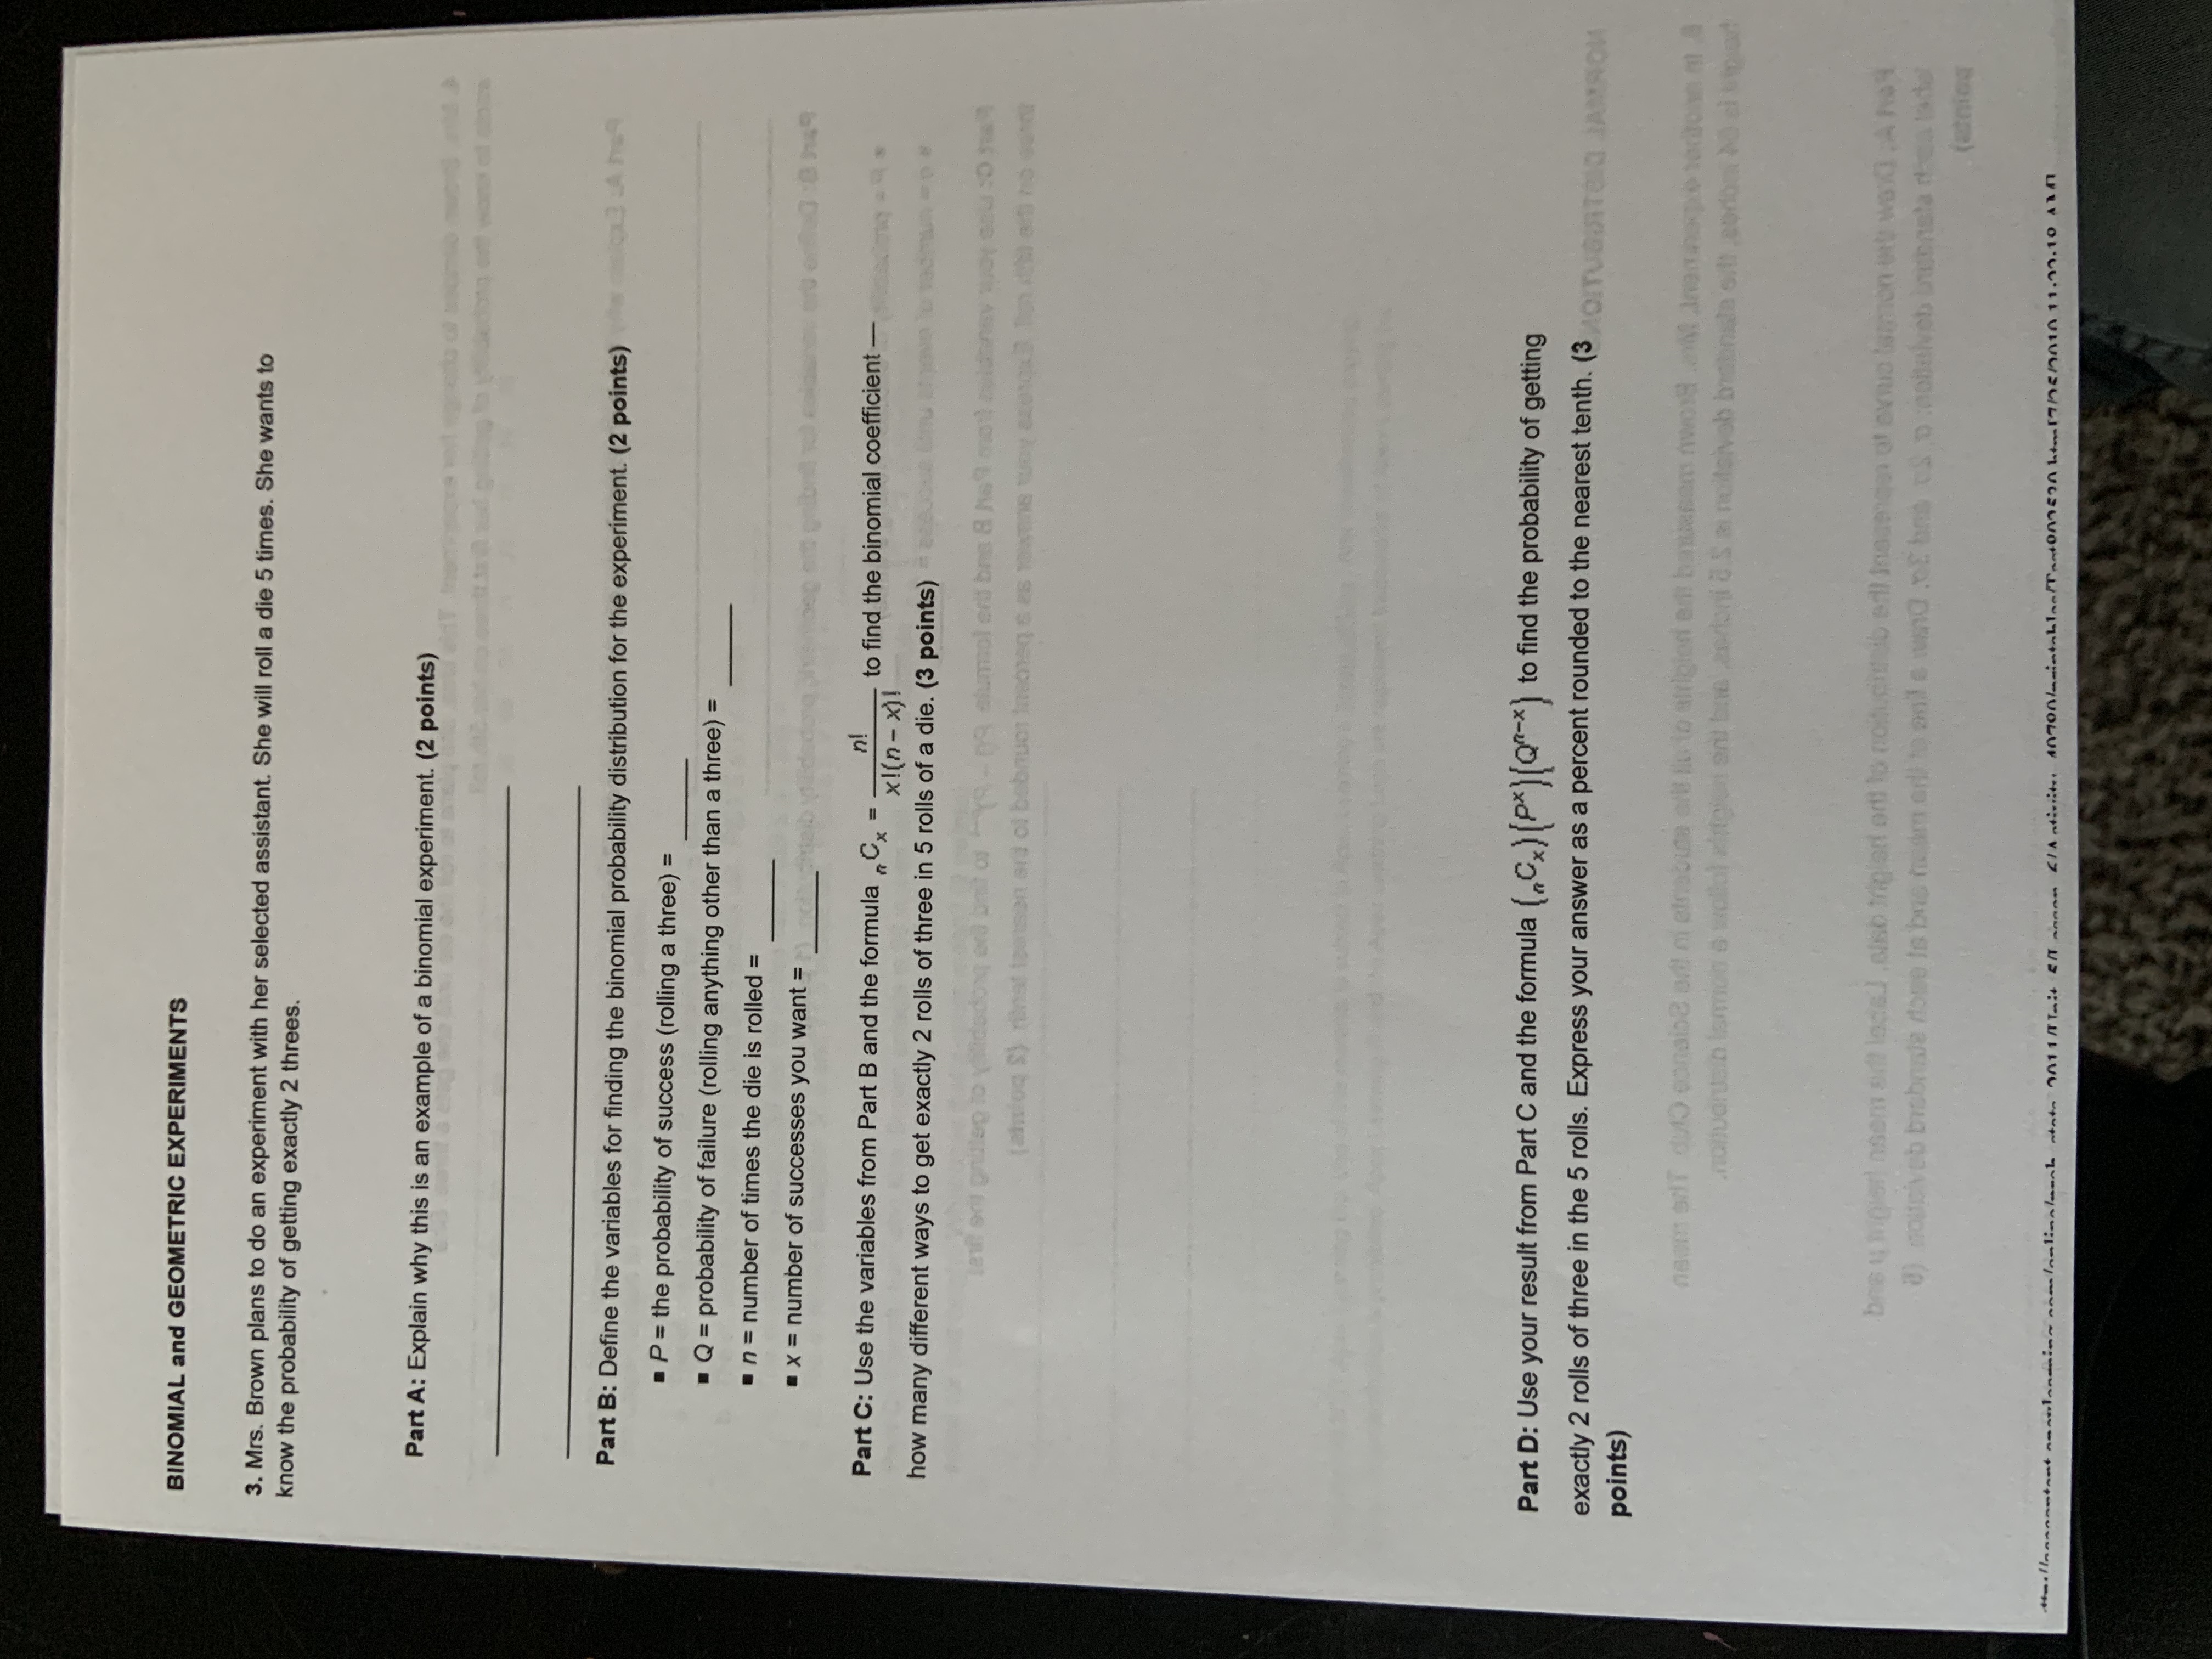
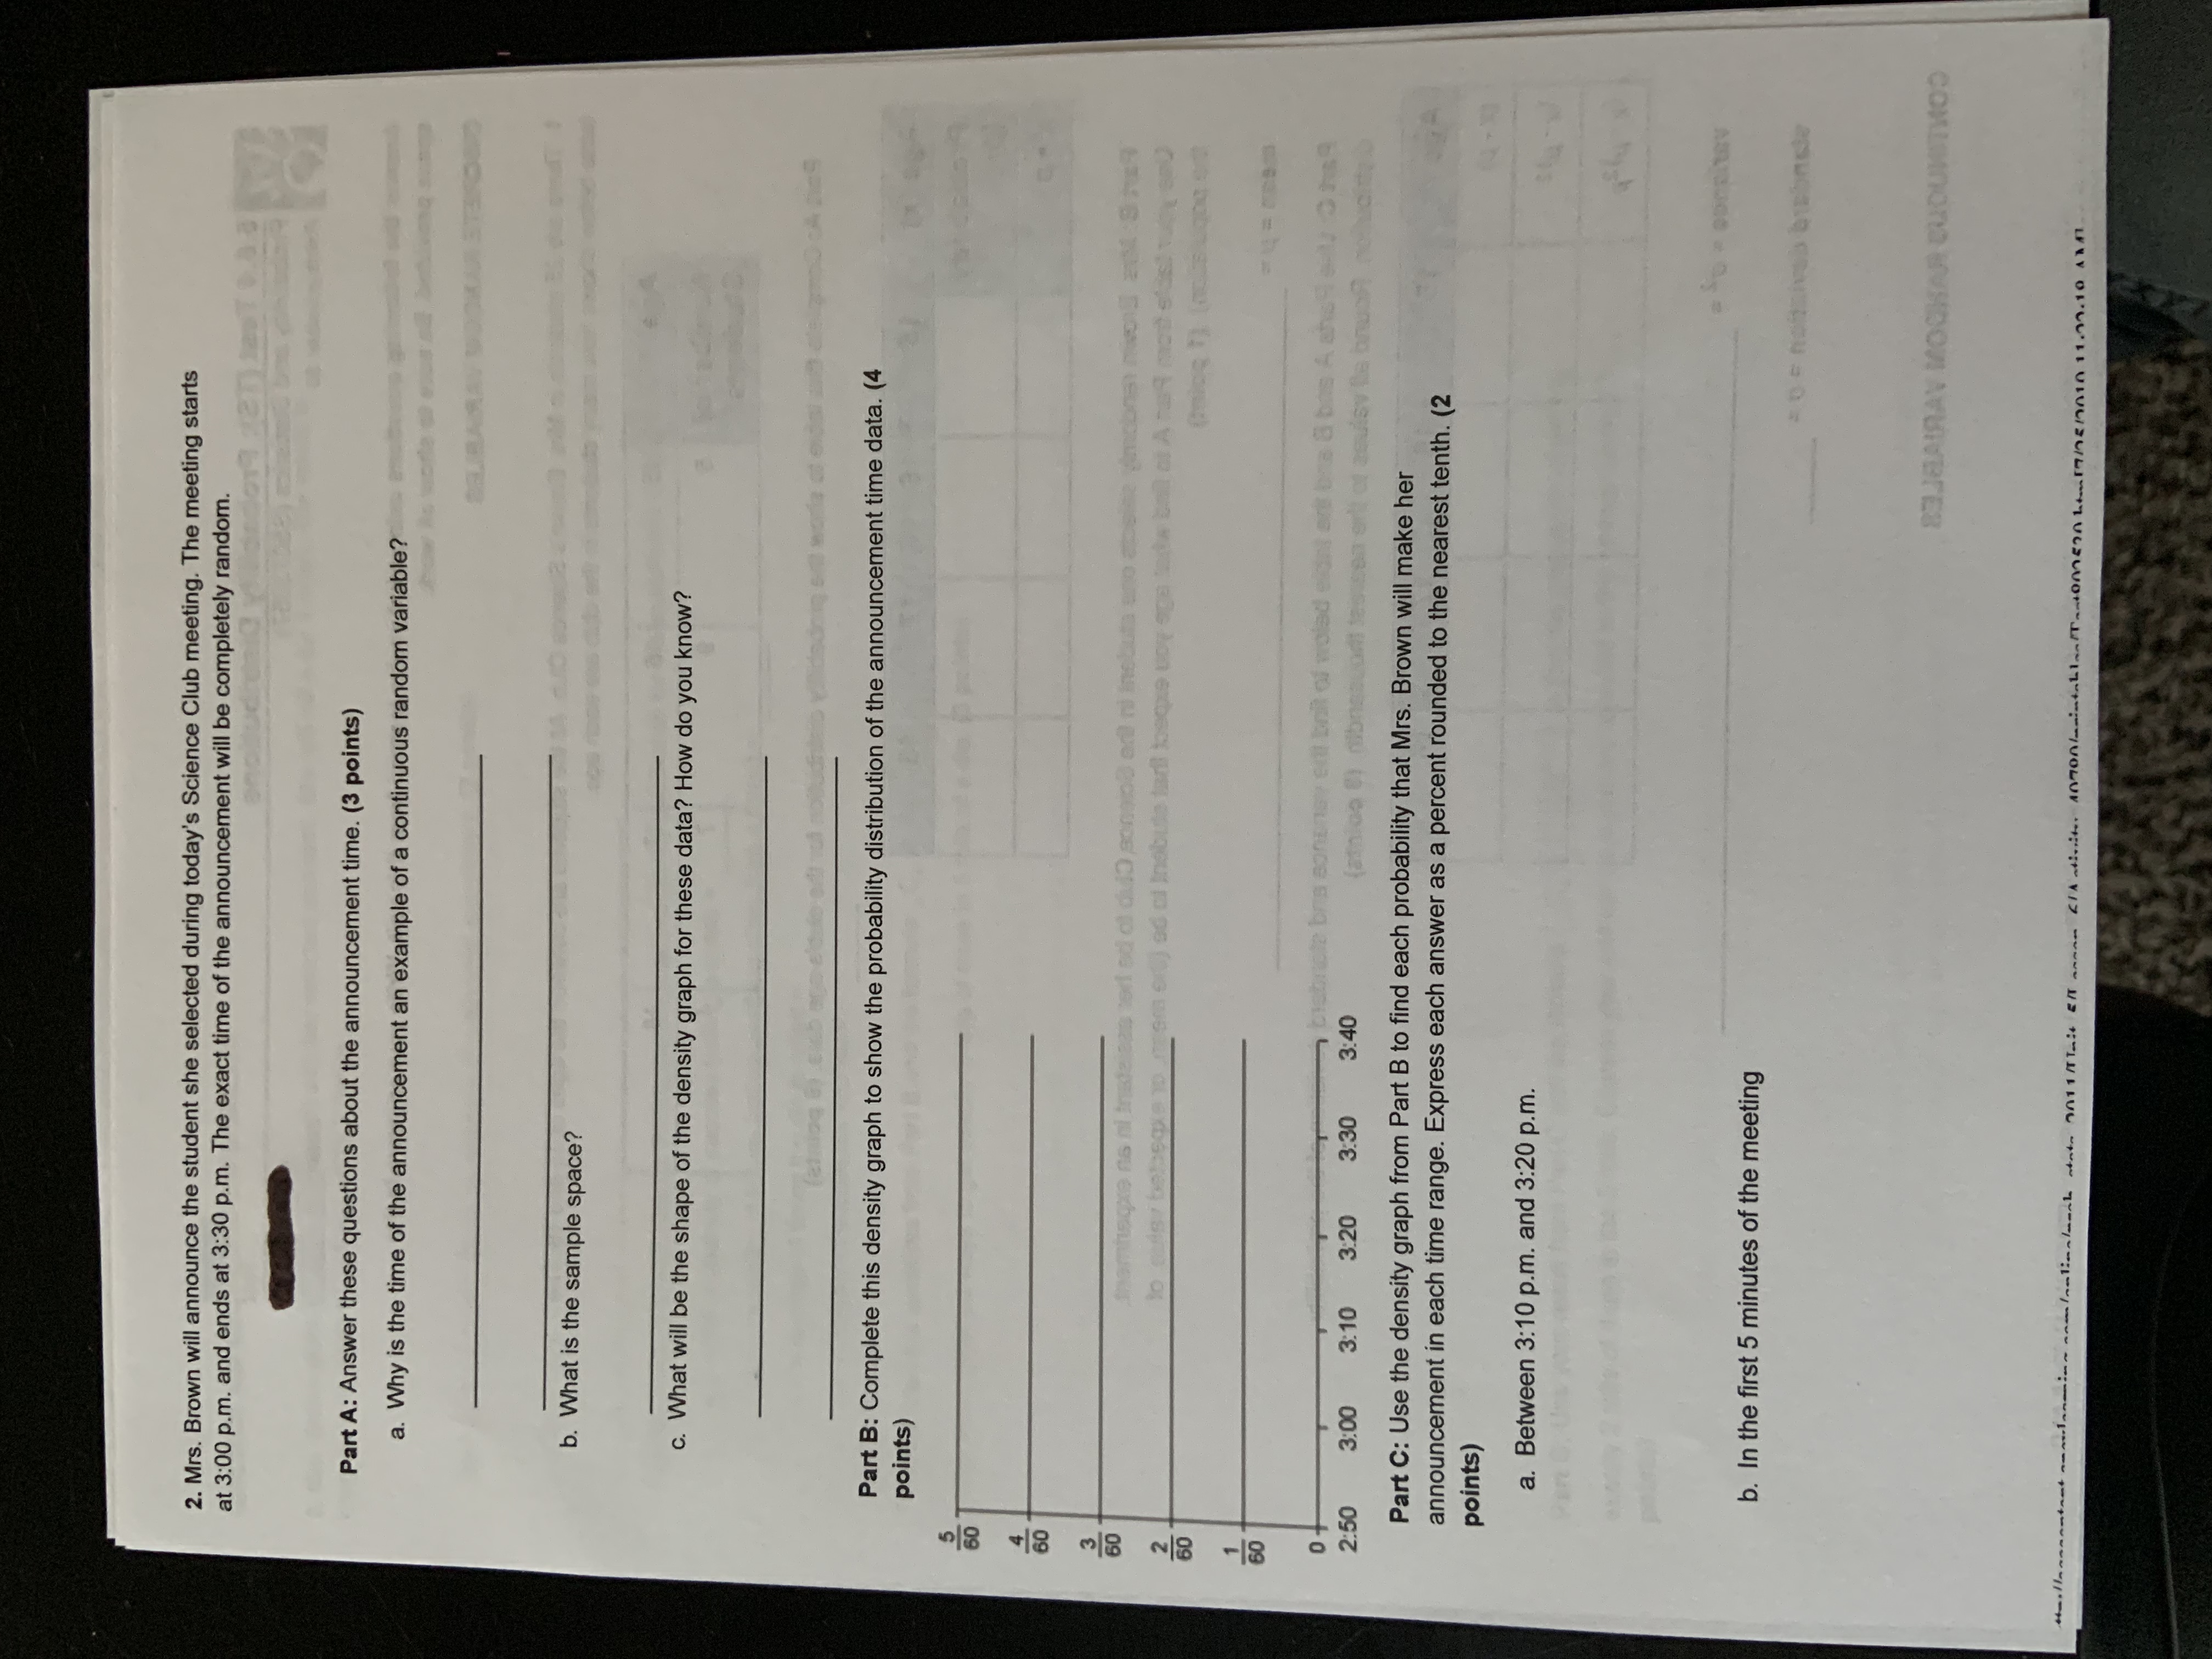
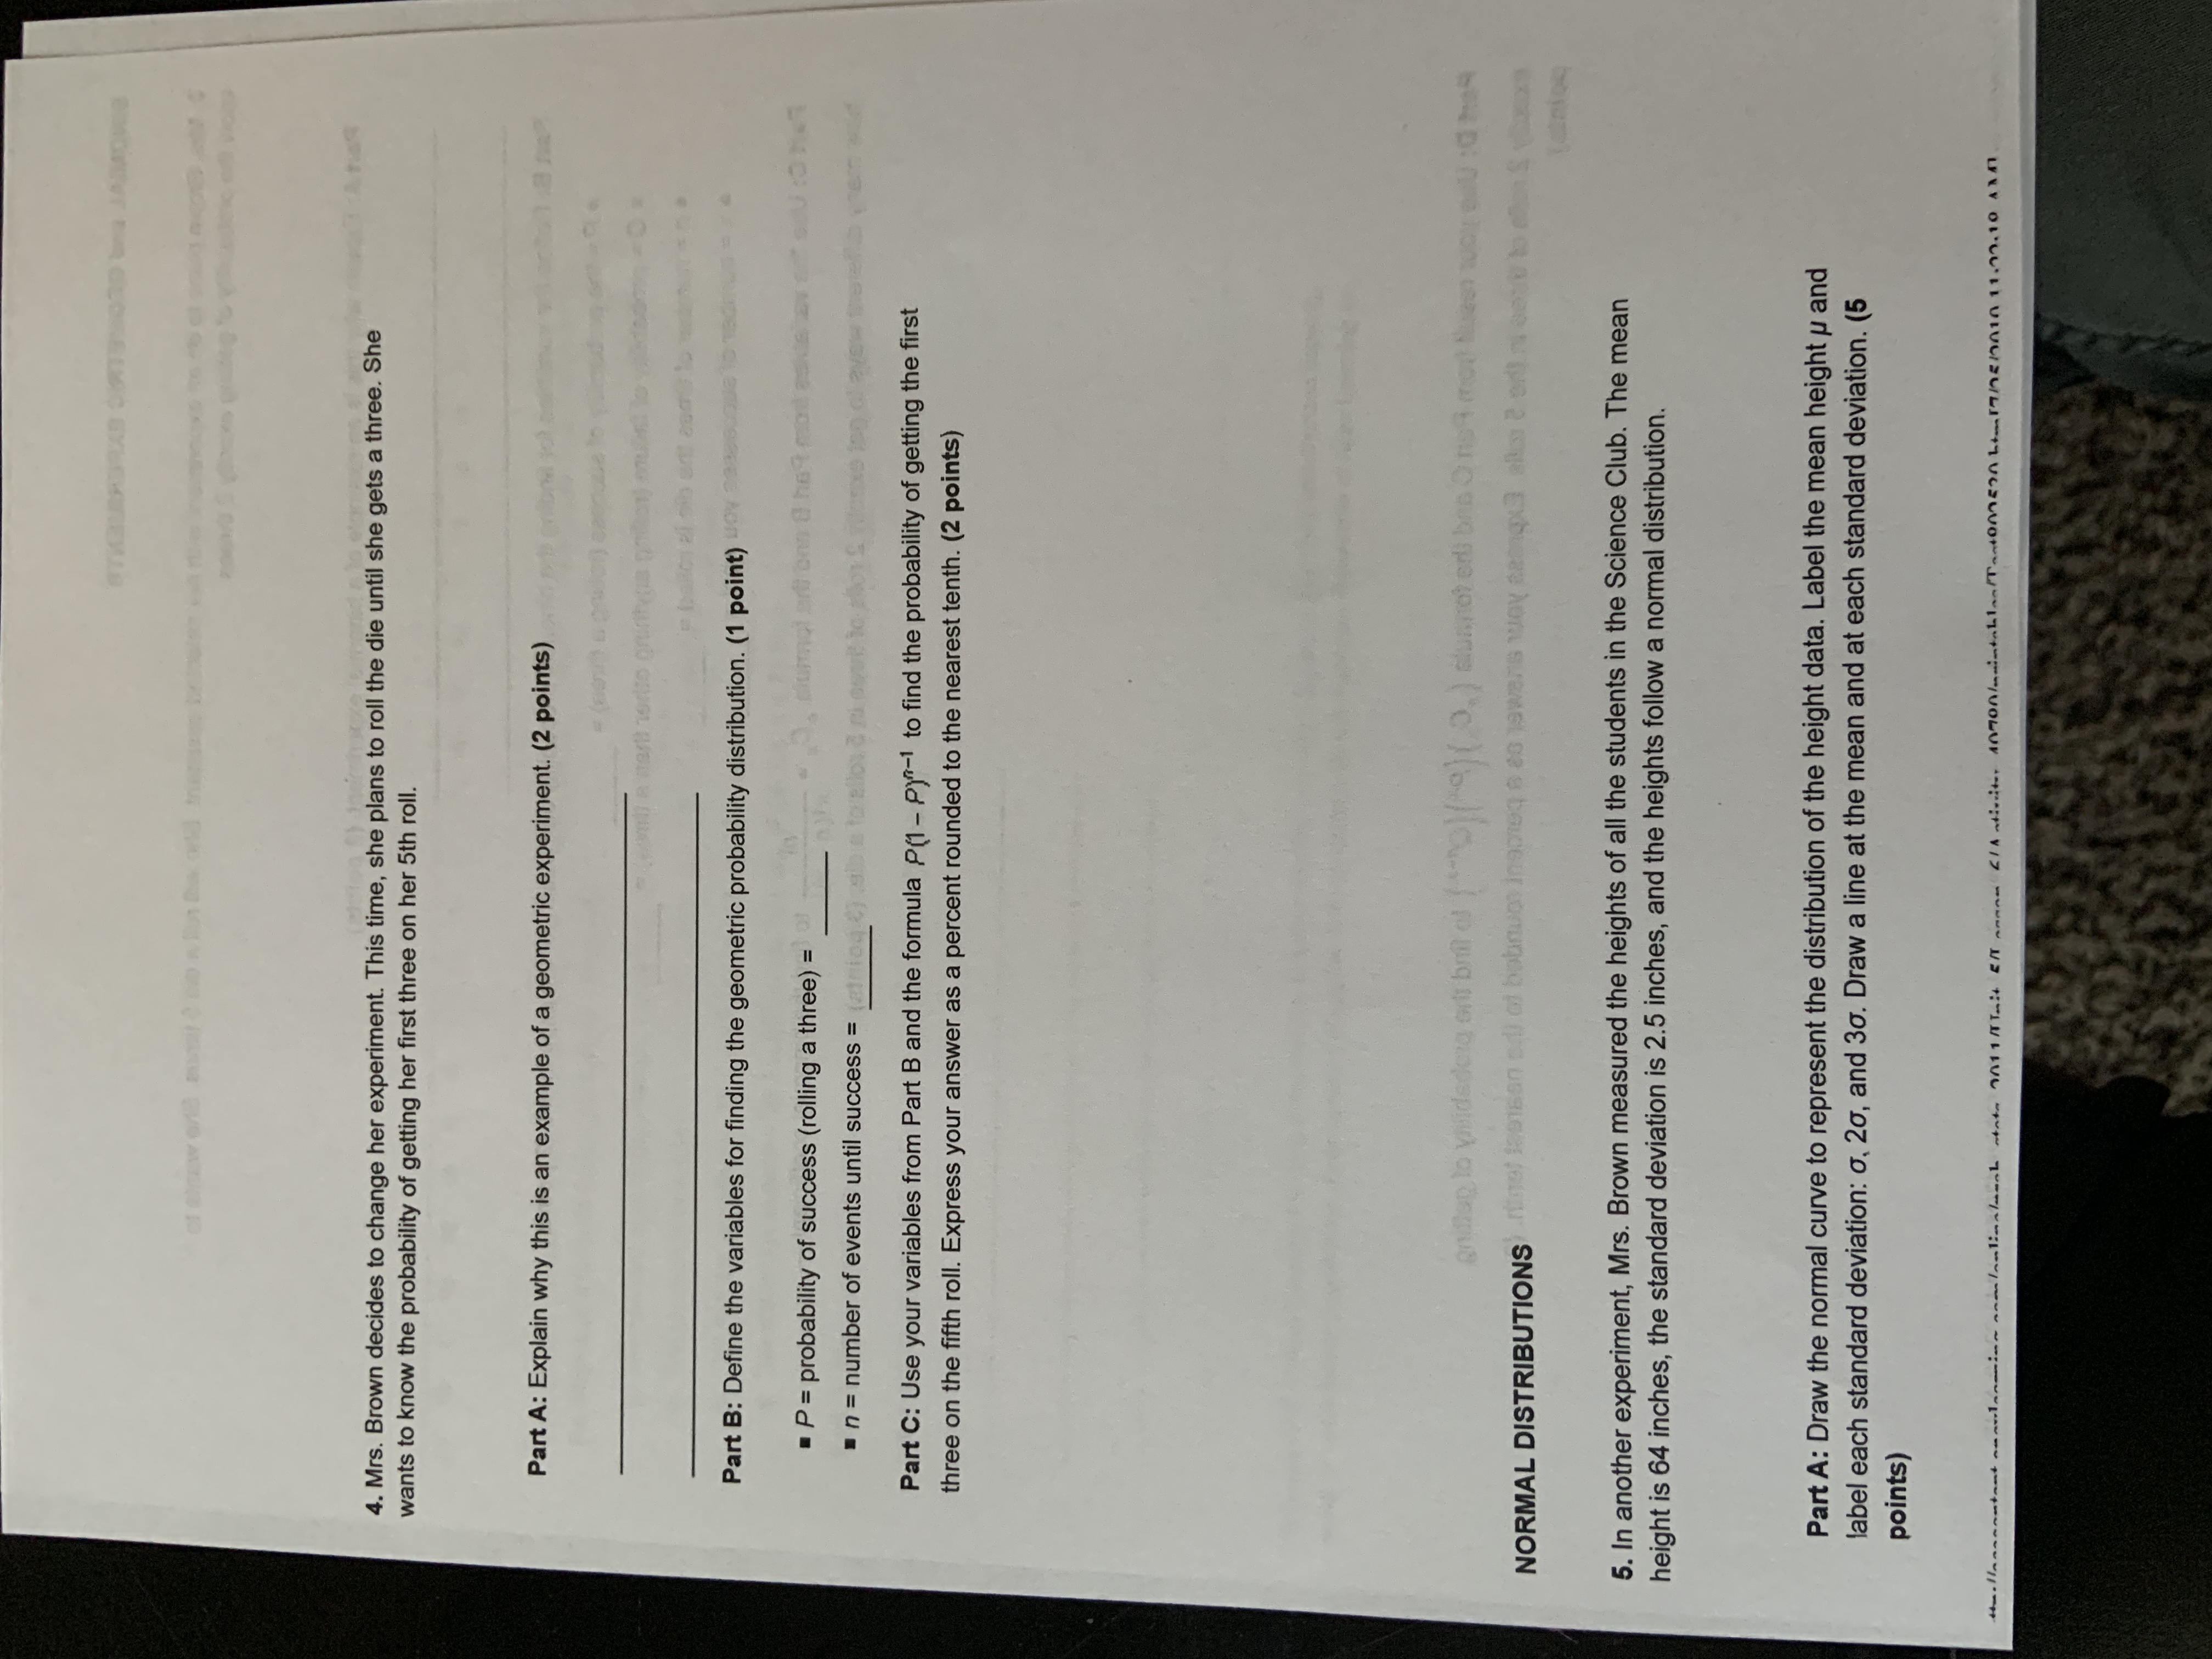
PRINT D 5.6.4 Test (TS): Probability Distributions 1/ Probability and Statistics ($5073357) Test Points possible: 50 Date: Answer the following questions using what you've learned from this unit. Write your answers in the space provided. Be sure to show all work. DISCRETE RANDOM VARIABLES 1. There are 25 students in Mrs. Brown's Science Club. All the students are between the ages of 15 and 18. The table below shows how many students in the club are each age. Age 15 16 17 18 Number of 5 Students Part A: Complete this table to show the probability distribution for the club's age data. (6 points) Age (x) 15 16 17 18 Probability (p) x . p Part B: Mrs. Brown randomly selects one student in the Science Club to be her assistant in an experiment. Use your table from Part A to find what age you expect that student to be (the mean, or expected value, of the population). (1 point) mean = U = Part C: Use Parts A and B and the table below to find the variance and standard deviation of the probability distribution. Round all values to the nearest thousandth. (8 points) Age 15 16 17 18 (ona nose bail of 8 71 mail dgang Vienob and sali to me ( X - H) ( x - 1 ) 2 m q OS:6 pre m.Q Gr & noowted .& ( x - 1 ) 2 p variance = 0% = grildom wed to soturing D'tril ed) of is standard deviation = 0 = CONTINUOUS RANDOM VARIABLES aminnlinalmanh state 2011/1 Tait EI saman ElAstinites 1070namintablas /Tanton=20 html7/5/2010 11.90.10 AMMI55 56 57 5 58 59 60 61 62 63 64 65 66 67 68 69 70 71 72 73 74 75 Part B: Mrs. Brown randomly selects a student in the Science Club. Use the normal curve from Part A and the empirical rule to find each probability. (4 points) a. The student is no more than 64 inches tall. P(x $ 64) = b. The student is between 61.5 and 66.5 inches tall. P(61.5 s x $ 66.5) = c. The student is between 59 and 69 inches tall. P(59 s x $ 69) = d. The student is between 56.5 and 71.5 inches tall. P(56.5 s x $ 71.5) = Part C: The student who Mrs. Brown selects is 68 inches tall. Use the formula z= (x - 4 ) to find the z- score for that height. What does that z-score mean? (2 points) Copyright @ 2017 Apex Learning Inc. Use of this material is subject to Apex Learning's Terms of Use . Any unauthorized copying, reuse, or redistribution is prohibited. Apex Learning @ and the Apex Learning Logo are registered trademarks of Apex Learning Inc.BINOMIAL and GEOMETRIC EXPERIMENTS 3. Mrs. Brown plans to do an experiment with her selected assistant. She will roll a die 5 times. She wants to know the probability of getting exactly 2 threes. Part A: Explain why this is an example of a binomial experiment. (2 points) Part B: Define the variables for finding the binomial probability distribution for the experiment. (2 points) P = the probability of success (rolling a three) = Q = probability of failure (rolling anything other than a three) = n = number of times the die is rolled = x = number of successes you want = Part C: Use the variables from Part B and the formula , Cx =- n! x! (n - x ) ! - to find the binomial coefficient - how many different ways to get exactly 2 rolls of three in 5 rolls of a die. (3 points) idodong and brill of Part D: Use your result from Part C and the formula (x) (px) (@*-x) to find the probability of getting exactly 2 rolls of three in the 5 rolls. Express your answer as a percent rounded to the nearest tenth. (3 ruquiTed JANSON points) (atnica2. Mrs. Brown will announce the student she selected during today's Science Club meeting. The meeting starts at 3:00 p.m. and ends at 3:30 p.m. The exact time of the announcement will be completely random. Part A: Answer these questions about the announcement time. (3 points) a. Why is the time of the announcement an example of a continuous random variable? b. What is the sample space? c. What will be the shape of the density graph for these data? How do you know? Part B: Complete this density graph to show the probability distribution of the announcement time data. (4 points) 60 60 g/w 60 60 abnote bris sonsnow elil bit of wolad elant art bre a ban A ahe feel/ 0 fund 2:50 3:00 3:10 3:20 3:30 3:40 Part C: Use the density graph from Part B to find each probability that Mrs. Brown will make her announcement in each time range. Express each answer as a percent rounded to the nearest tenth. (2 points) a. Between 3:10 p.m. and 3:20 p.m. So . poppitev b. In the first 5 minutes of the meeting BJJGAIRAY MOCHAR CUOUNITMOD4. Mrs. Brown decides to change her experiment. This time, she plans to roll the die until she gets a three. She A ties wants to know the probability of getting her first three on her 5th roll. Part A: Explain why this is an example of a geometric experiment. (2 points) Part B: Define the variables for finding the geometric probability distribution. (1 point) P = probability of success (rolling a three) = n = number of events until success = torallow a mi on Part C: Use your variables from Part B and the formula p(1 - p)"-1 to find the probability of getting the first three on the fifth roll. Express your answer as a percent rounded to the nearest tenth. (2 points) NORMAL DISTRIBUTIONSon all of bobing insmog n es swent way samo() all ? or i sent to chin S value 5. In another experiment, Mrs. Brown measured the heights of all the students in the Science Club. The mean height is 64 inches, the standard deviation is 2.5 inches, and the heights follow a normal distribution. Part A: Draw the normal curve to represent the distribution of the height data. Label the mean height p and label each standard deviation: o, 20, and 30. Draw a line at the mean and at each standard deviation. (5 points)
