

Answered step by step
Verified Expert Solution
Question
1 Approved Answer
PRISCOLL COMPANY Balance Sheets December 31 2018 2019 $ 70,000 65,000 55,000 40,000 104,000 90,000 230,000 165,000 25,000 23,000 130,000 130,000 260,000 185,000 $874,000 $698,000
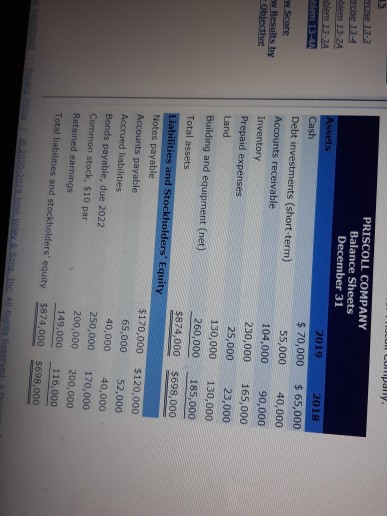
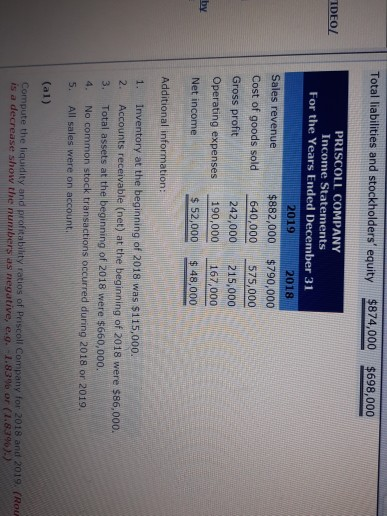
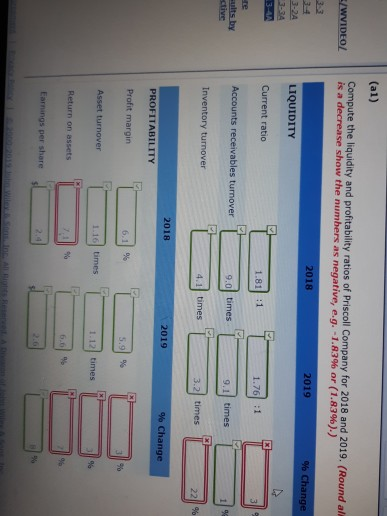
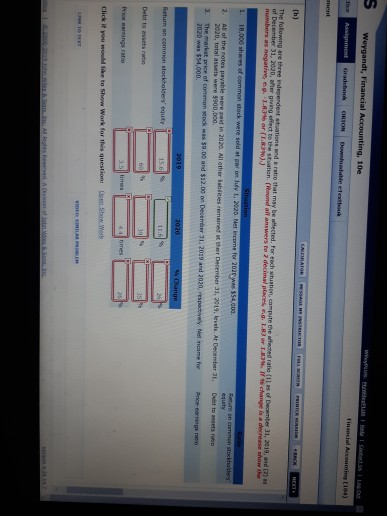
PRISCOLL COMPANY Balance Sheets December 31 2018 2019 $ 70,000 65,000 55,000 40,000 104,000 90,000 230,000 165,000 25,000 23,000 130,000 130,000 260,000 185,000 $874,000 $698,000 Cash Debt investments (short-term) Accounts receivable Inventory Prepaid expenses Land Building and equipment (net) Total assets Liabilities and Stockholders' Equity Notes payable Accounts payable $170,000 $120,000 65,000 52,000 40,000 40,000 250,000 170,000 200,000 200,000 149,000 116,000 Total liabilities and stockholders' equity $874,000 5698,000 Bonds payable, due 2022 Common stock, $10 par Total liabilities and stockholders equity 874,000 $698,000 PRISCOLL COMPANY Income Statements For the Years Ended December 31 IDEO 2018 2019 Sales revenue Cost of goods sold Gross profit Operating expenses Net income $882,000 $790,000 575,000 640,000 242,000215,000 190,000 $ 52,000 48,000 167,000 Additional information 1. Inventory at the beginning of 2018 was $115,000. 2. Accounts receivable (net) at the beginning of 2018 were $86,000. 3. Total assets at the beginning of 2018 were $660,000. 4. No common stock transactions occurred during 2018 or 2019. 5. All sales were on account (al) Compute the liquidity and proftability ratios of Priscol Company for 2018 and 2019, (Rou is a decrease show the numbers as negative (a1) Compute the liquidity and profitability ratios of Priscoll Company for 2018 and 2019. (Round ali is a decrease show the numbers as negative, e.g.-1.8396 or (1.8396) .) % Change 2019 2018 LIQUIDITY 1.81 :1 1.76 1 Current ratio Accounts receivables turnover 9.1 times times -- Inventory turnover 3.2 times 2019 % Change 2018 PROFITABILITY Profit margin 6.11 % 1.12l times Asset turnover 1.16 times Return on assets Earnings per share Weygandt, Financial Accounting, 10e 104) The folomng are three ndependent station. sd rino that may bntected for ted, stu,tion, compute oe-ered ratio { l as of December 31, 2019, and (2) as of December 31, 2020, ater giving effect to the situation. ( , 1.83% ar (1.83%).) as negative, e.g. 1 18,000 shares of common stock were sold at par on Jdy t, 2020. Net income for 2020 was $54,003 2. All of the notes payable were paid in 2020. All other abiries emairesd it ther December 31, 3. The market price of common sock mas 59.00 and $12.00 on December 31. 2039 and 2020, vespactvey Net incame for Price enigs ro 31, 2019, levels. At December 3. Debt to wosets rabo 2020, total assets were $900,000 2020 was $54,000 Return on common stockholters' equty Debt to assets ratio Click if you would like to Show Work for this question: sm,.Sbow Werk
Step by Step Solution
There are 3 Steps involved in it
Step: 1

Get Instant Access to Expert-Tailored Solutions
See step-by-step solutions with expert insights and AI powered tools for academic success
Step: 2

Step: 3
Ace Your Homework with AI
Get the answers you need in no time with our AI-driven, step-by-step assistance
Get Started
Managerial Accounting
Authors: Carl S. Warren, James M. Reeve, Jonathan E. Duchac
10th Edition
B010IKDQZM