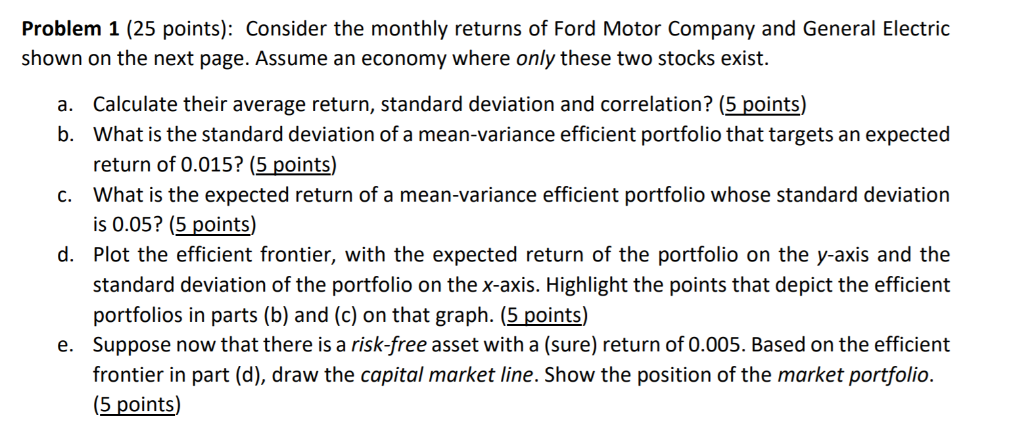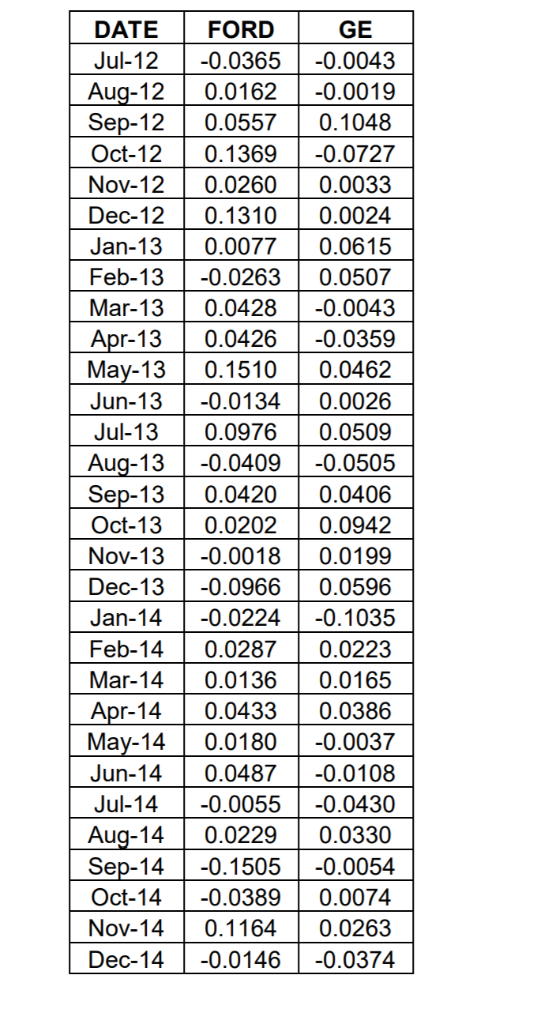

Problem 1 (25 points): Consider the monthly returns of Ford Motor Company and General Electric shown on the next page. Assume an economy where only these two stocks exist. Calculate their average return, standard deviation and correlation? (5 points) What is the standard deviation of a mean-variance efficient portfolio that targets an expected return of 0.015? (5 points) What is the expected return of a mean-variance efficient portfolio whose standard deviation is 0.05? (5 points) Plot the efficient frontier, with the expected return of the portfolio on the y-axis and the standard deviation of the portfolio on the x-axis. Highlight the points that depict the efficient portfolios in parts (b) and (c) on that graph. (5 points) Suppose now that there is a risk-free asset with a (sure) return of 0.005. Based on the efficient frontier in part (d), draw the capital market line. Show the position of the market portfolio. (5 points) a. b. c. d. e. GE DATE FORD Jul-12 -0.0365 -0.0043 Aug-12 0.0162 0.0019 Sep-12 0.0557 0.1048 Oct-12 0.1369 -0.0727 Nov-12 0.0260 0.0033 Dec-12 0.1310 0.0024 Jan-13 0.0077 0.0615 Feb-130.0263 0.0507 Mar-13 | 0.0428 | -0.0043 Apr-13 0.0426-0.0359 May-13 0.1510 0.0462 Jun-130.0134 0.0026 Jul-130.0976 0.0509 Aug-13-0.0409-0.0505 Sep-13 0.04200.0406 Oct-13 0.0202 0.0942 Nov-13 | -0.0018 | 0.0199 Dec-130.09660.0596 Jan-14-0.0224-0.1035 Feb-14 0.0287 0.0223 Mar-14 0.0136 0.0165 Apr-14 0.0433 0.0386 May-14 | 0.0180 | -0.0037 Jun-14 0.0487-0.0108 Jul-14 0.0055 -0.0430 Auq-14 0.02290.0330 Sep-140.1505 -0.0054 Oct-14 0.0389 0.0074 Nov-140.1164 0.0263 Dec-140.0146 -0.0374 Problem 1 (25 points): Consider the monthly returns of Ford Motor Company and General Electric shown on the next page. Assume an economy where only these two stocks exist. Calculate their average return, standard deviation and correlation? (5 points) What is the standard deviation of a mean-variance efficient portfolio that targets an expected return of 0.015? (5 points) What is the expected return of a mean-variance efficient portfolio whose standard deviation is 0.05? (5 points) Plot the efficient frontier, with the expected return of the portfolio on the y-axis and the standard deviation of the portfolio on the x-axis. Highlight the points that depict the efficient portfolios in parts (b) and (c) on that graph. (5 points) Suppose now that there is a risk-free asset with a (sure) return of 0.005. Based on the efficient frontier in part (d), draw the capital market line. Show the position of the market portfolio. (5 points) a. b. c. d. e. GE DATE FORD Jul-12 -0.0365 -0.0043 Aug-12 0.0162 0.0019 Sep-12 0.0557 0.1048 Oct-12 0.1369 -0.0727 Nov-12 0.0260 0.0033 Dec-12 0.1310 0.0024 Jan-13 0.0077 0.0615 Feb-130.0263 0.0507 Mar-13 | 0.0428 | -0.0043 Apr-13 0.0426-0.0359 May-13 0.1510 0.0462 Jun-130.0134 0.0026 Jul-130.0976 0.0509 Aug-13-0.0409-0.0505 Sep-13 0.04200.0406 Oct-13 0.0202 0.0942 Nov-13 | -0.0018 | 0.0199 Dec-130.09660.0596 Jan-14-0.0224-0.1035 Feb-14 0.0287 0.0223 Mar-14 0.0136 0.0165 Apr-14 0.0433 0.0386 May-14 | 0.0180 | -0.0037 Jun-14 0.0487-0.0108 Jul-14 0.0055 -0.0430 Auq-14 0.02290.0330 Sep-140.1505 -0.0054 Oct-14 0.0389 0.0074 Nov-140.1164 0.0263 Dec-140.0146 -0.0374


