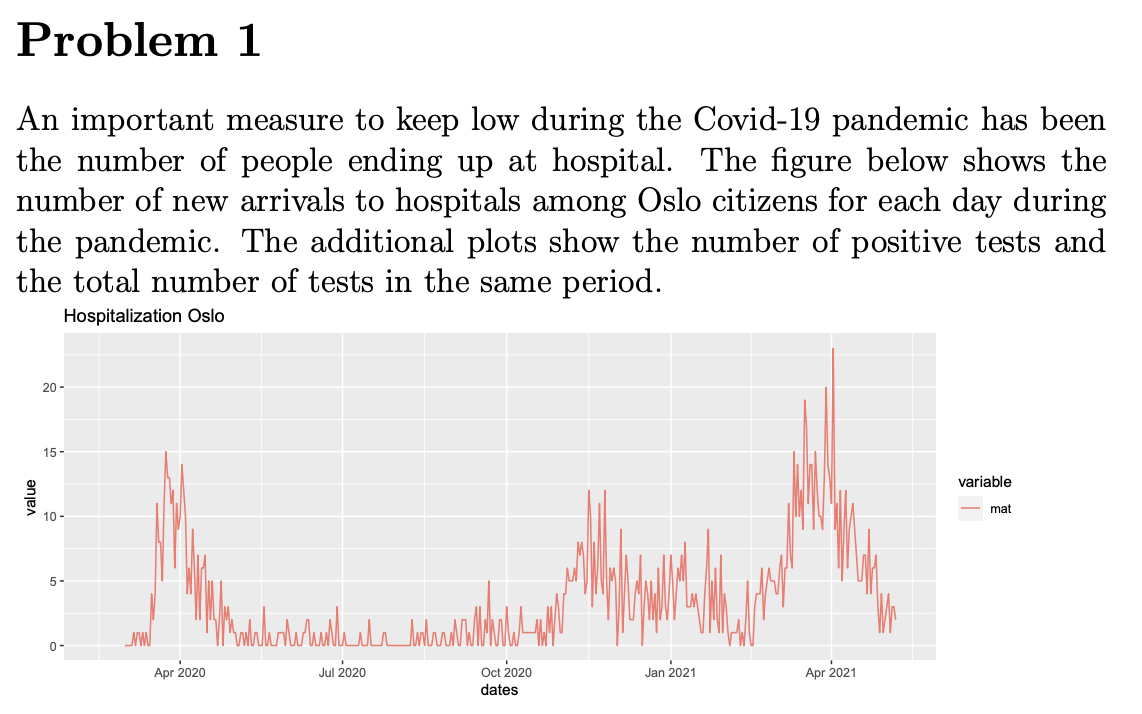
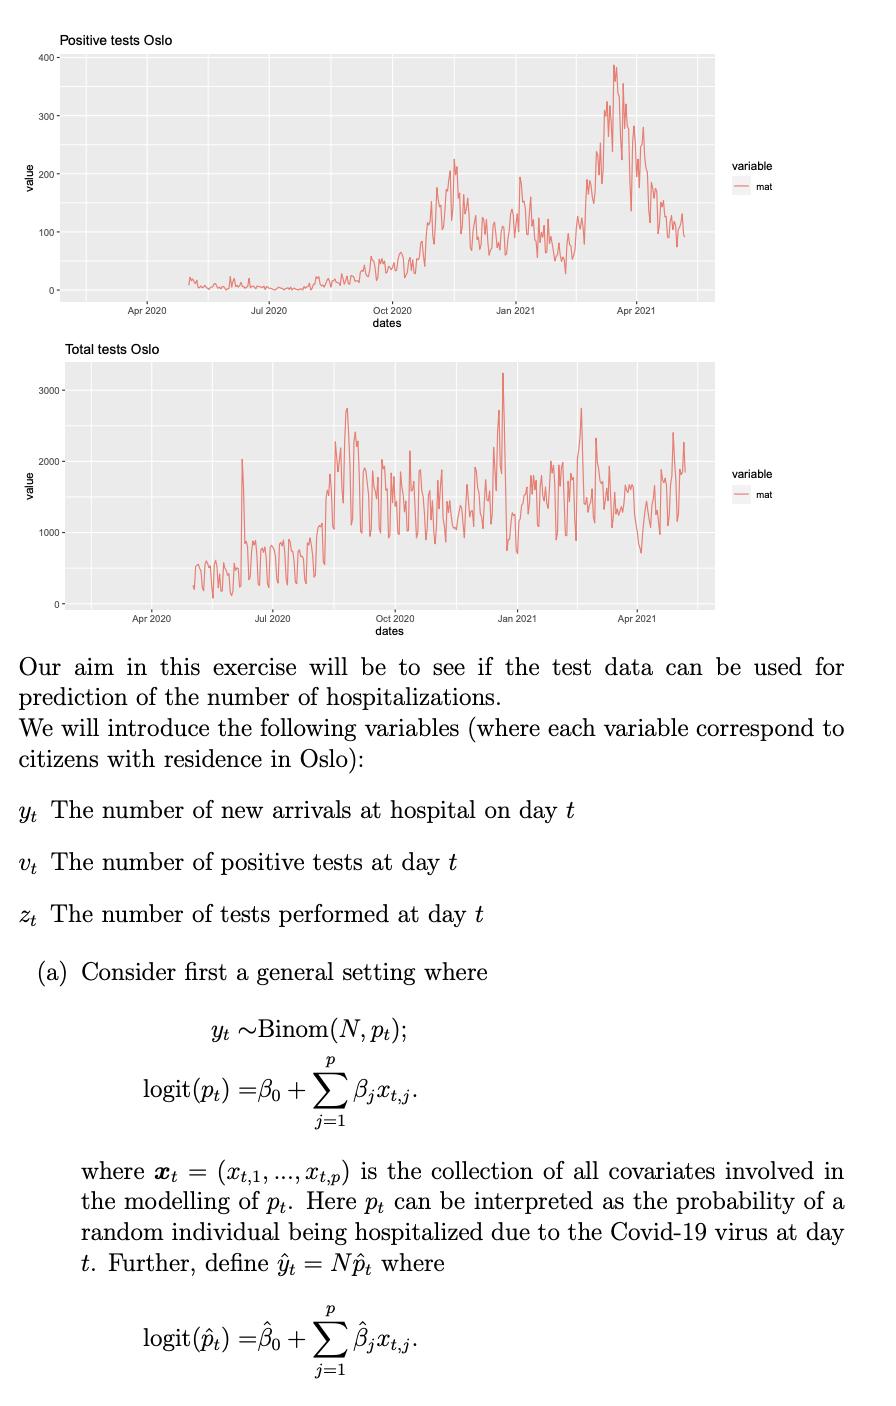
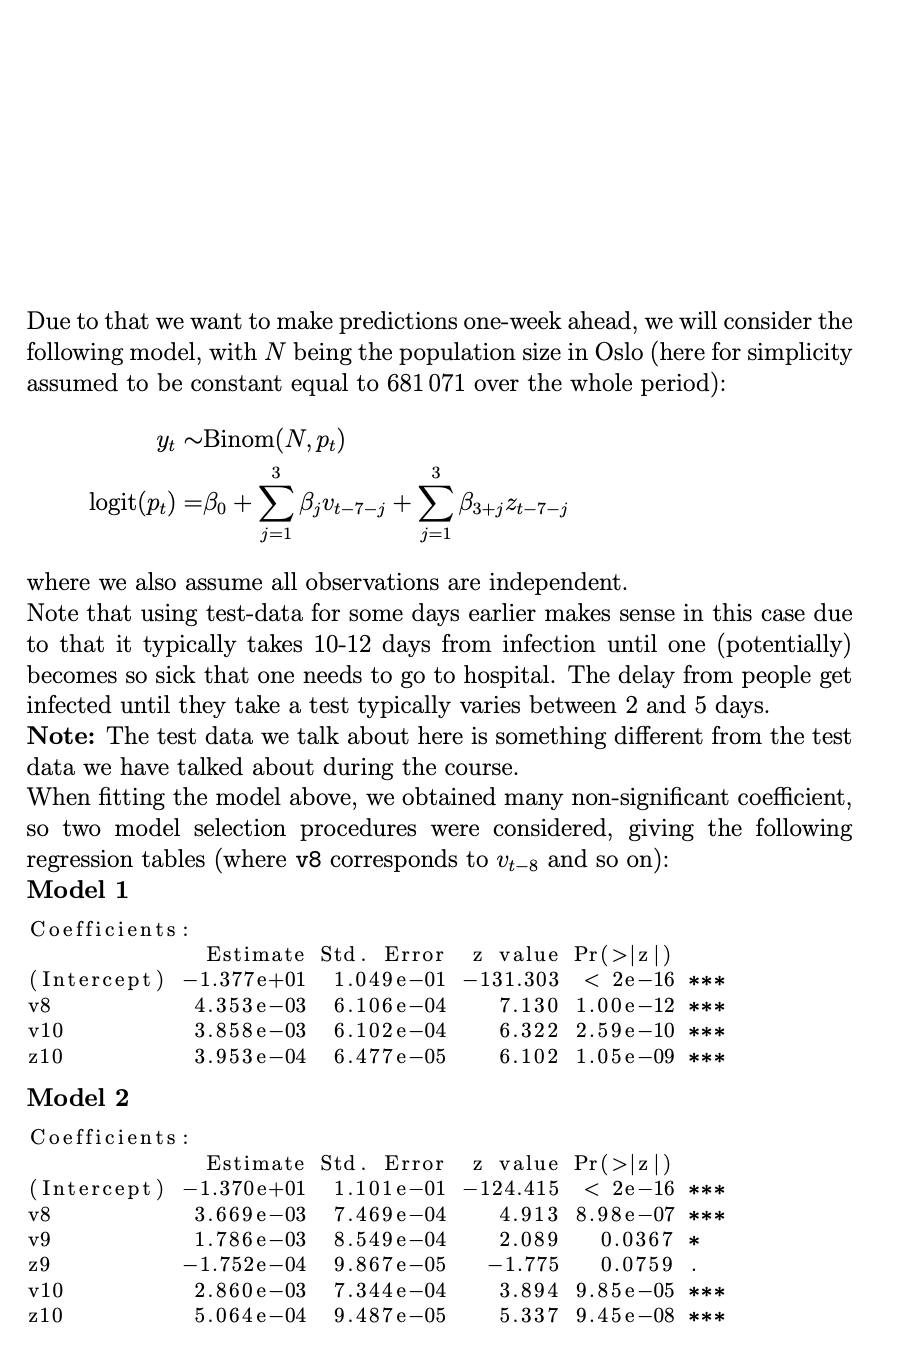
Problem 1 An important measure to keep low during the Covid-19 pandemic has been the number of people ending up at hospital. The figure below shows the number of new arrivals to hospitals among Oslo citizens for each day during the pandemic. The additional plots show the number of positive tests and the total number of tests in the same period. Hospitalization Oslo 20 15 - variable value mat 10 5- Madelante walialan laluando 0 Apr 2020 Jul 1 2020 Oct 2020 Jan 2021 Apr 2021 dates Positive tests Oslo 400- 300- variable 9 200 - 100 - Mumthihamam www 0- Apr 2020 Jul 2020 Jan 2021 Oct 2020 dates Apr 2021 Total tests Oslo 3000 - 2000 variable La la la mat 1000 0 Apr 2020 Jul 2020 Jan 2021 Apr 2021 Oct 2020 dates Our aim in this exercise will be to see if the test data can be used for prediction of the number of hospitalizations. We will introduce the following variables (where each variable correspond to citizens with residence in Oslo): yt The number of new arrivals at hospital on day t Vt The number of positive tests at day t zz The number of tests performed at day t (a) Consider first a general setting where Yt ~Binom(N, pt); logit (pt) =Bo + Bjxt,j. j=1 where t = (Xt,1, ..., Xt,p) is the collection of all covariates involved in the modelling of pt. Here pt can be interpreted as the probability of a random individual being hospitalized due to the Covid-19 virus at day t. Further, define t = Nt where logit (@t) =o + B;lt,je j=1 Due to that we want to make predictions one-week ahead, we will consider the following model, with N being the population size in Oslo (here for simplicity assumed to be constant equal to 681071 over the whole period): Yt ~Binom(N, pt) 3 3 logit (pt) =Bo + B;v27j + B3+jZt-7j + j=1 j=1 where we also assume all observations are independent. Note that using test-data for some days earlier makes sense in this case due to that it typically takes 10-12 days from infection until one (potentially) becomes so sick that one needs to go to hospital. The delay from people get infected until they take a test typically varies between 2 and 5 days. Note: The test data we talk about here is something different from the test data we have talked about during the course. When fitting the model above, we obtained many non-significant coefficient, so two model selection procedures were considered, giving the following regression tables (where v8 corresponds to Vt-8 and so on): Model 1 Coefficients : Estimate Std. Error z value Pr(>121) (Intercept) - 1.377e+01 1.049 e-01 - 131.303 121) (Intercept) - 1.370e+01 1.101e-01 -124.415 12D (Intercept) -13.51069 0.65941 -20.489 121) (Intercept) - 14.0226 0.7699 -18.213 121) (Intercept) - 1.377e+01 1.049 e-01 - 131.303 121) (Intercept) - 1.370e+01 1.101e-01 -124.415 12D (Intercept) -13.51069 0.65941 -20.489 121) (Intercept) - 14.0226 0.7699 -18.213