Question
Problem 1 Consider the existing scenario in the post office (before any improvements are implemented). a) Assume that there is a separate queue for each


Problem 1 Consider the existing scenario in the post office (before any improvements are implemented).
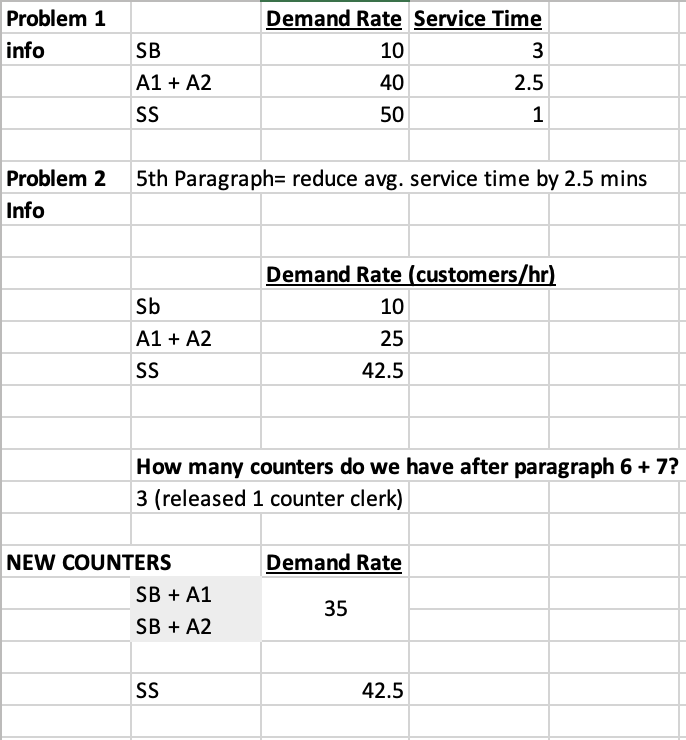
a) Assume that there is a separate queue for each of the following: 1) Counter for savings bank services (SB); 2) First counter for accountable services (A1); 3) Second counter for accountable services (A2); and 4) Counter for stamps and stationary services (SS). i. (5 points) Calculate a customers expected waiting time in each of the four queues ii. (5 points) Calculate the average number of customers in each of the four queues iii. (5 points) Calculate a customers total expected time in the system for each queue iv. (10 points) Calculate the average time a customer spends in the post office, averaged across all customers.
b) Now assume that there is a common queue for accountable transactions. In other words, assume a separate queue for each of the following: 1) Counter for savings bank services (SB); 2) Both counters for accountable services (A1&A2 combined, so that there is only 1 queue for accountable services); and 3) Counter for stamps and stationary services (SS). i. (5 points) Calculate a customers expected waiting time in each of the three queues ii. (5 points) Calculate the average number of customers in each of the three queues iii. (5 points) Calculate a customers total expected time in the system for each queue iv. (10 points) Calculate the average time a customer spends in the post office, averaged across all customers.
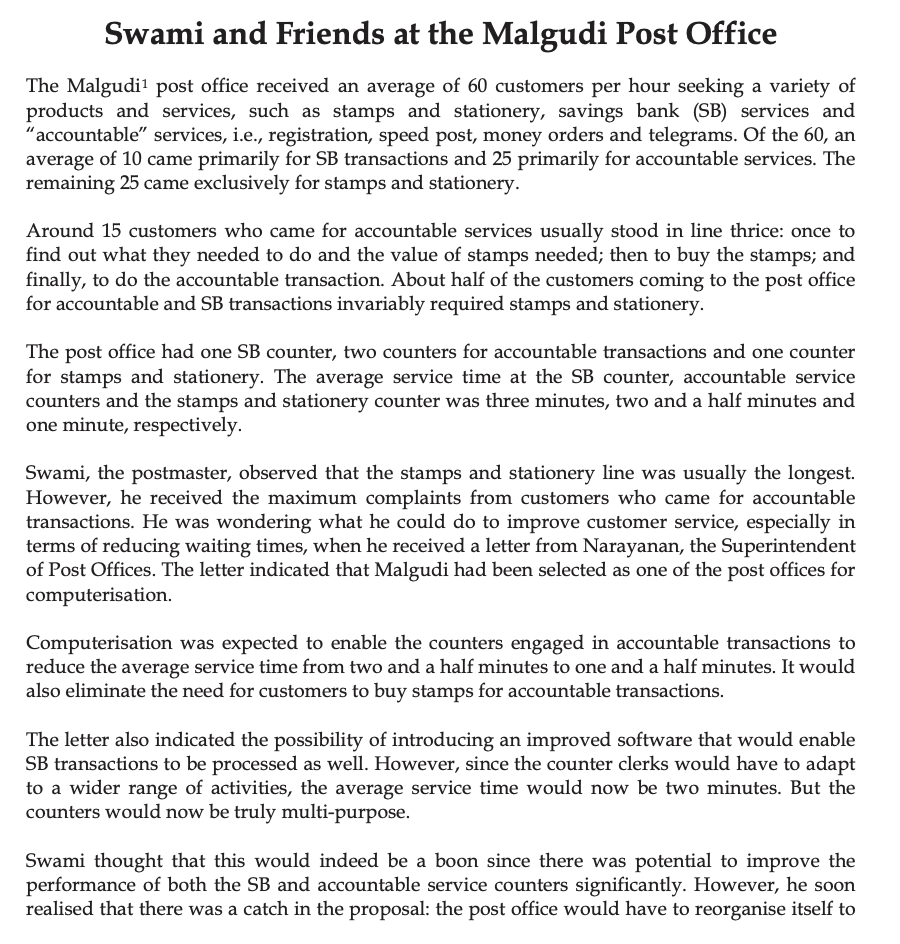
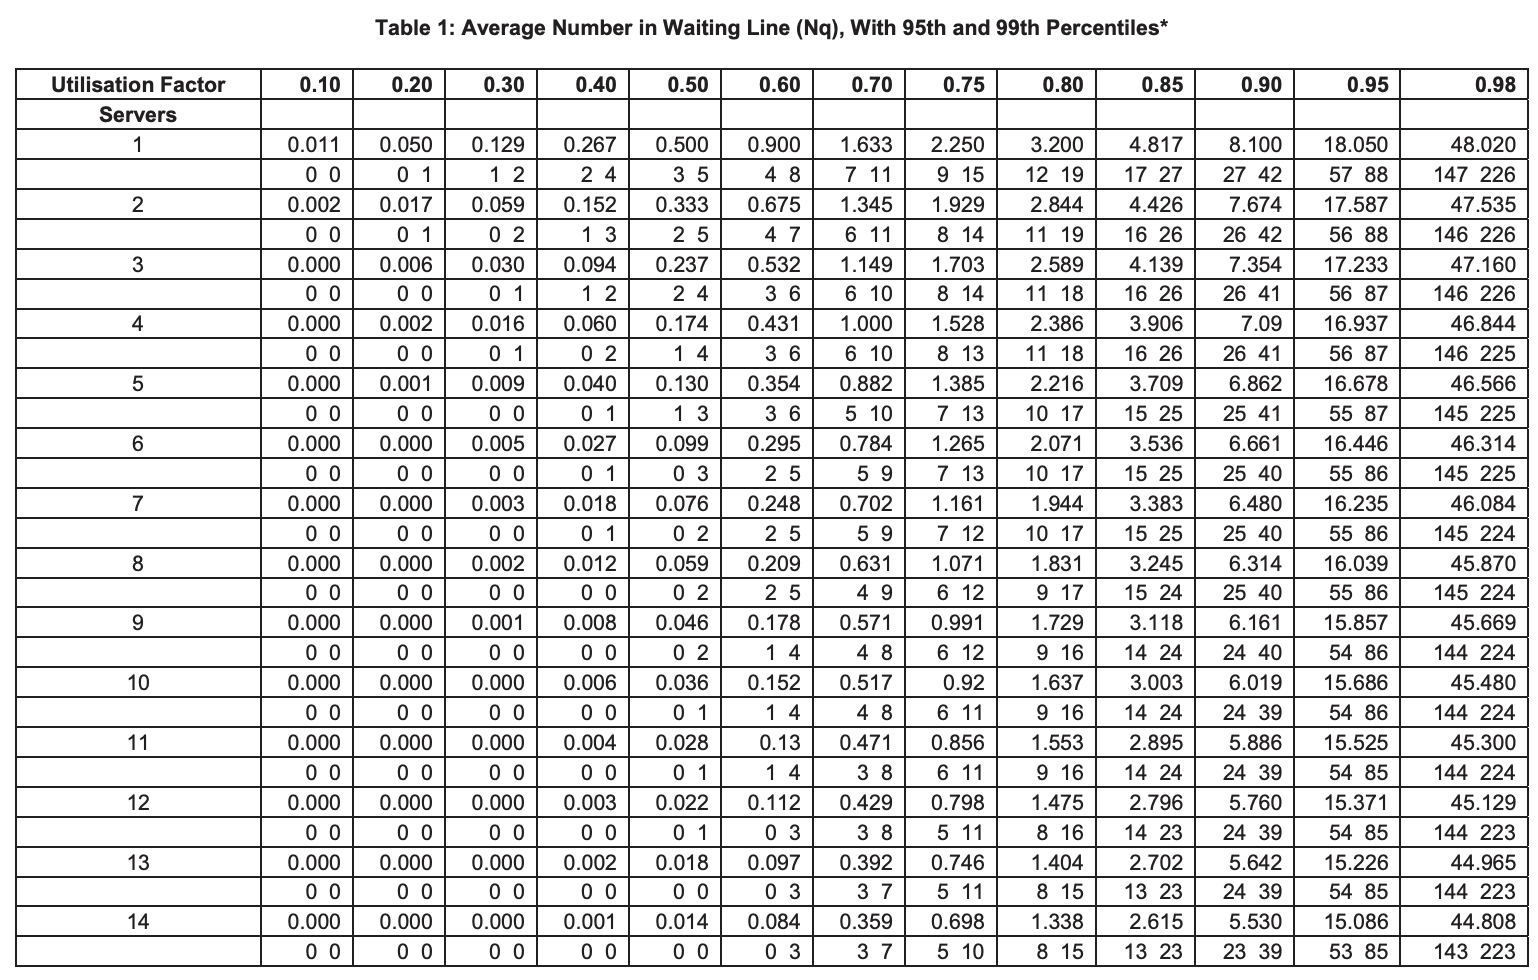
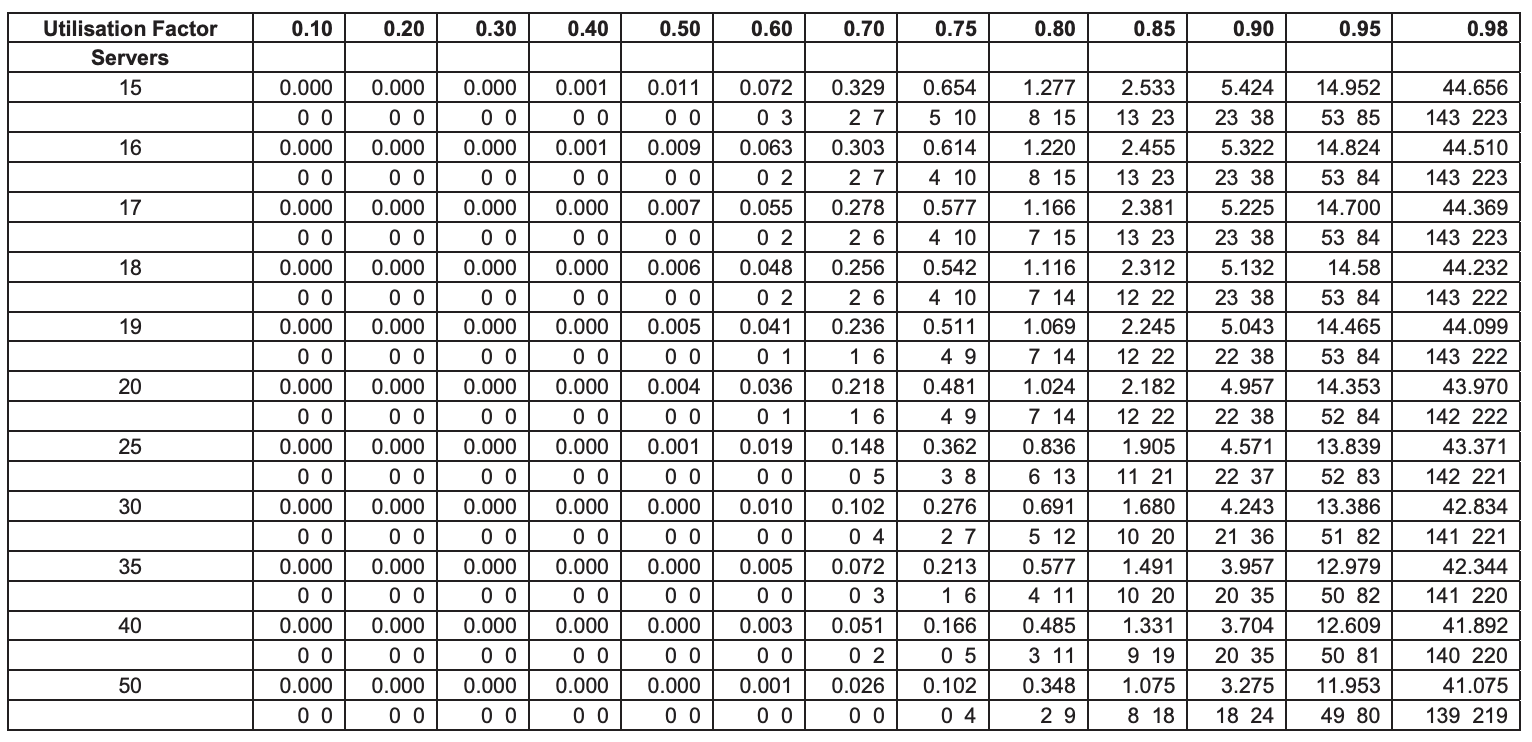
Swami and Friends at the Malgudi Post Oft1ce The Malgudi 1 post office received an average of 60 customers per hour seeking a variety of products and services, such as stamps and stationery, savings bank (SB) services and "accountable" services, i.e., registration, speed post, money orders and telegrams. Of the 60 , an average of 10 came primarily for SB transactions and 25 primarily for accountable services. The remaining 25 came exclusively for stamps and stationery. Around 15 customers who came for accountable services usually stood in line thrice: once to find out what they needed to do and the value of stamps needed; then to buy the stamps; and finally, to do the accountable transaction. About half of the customers coming to the post office for accountable and SB transactions invariably required stamps and stationery. The post office had one SB counter, two counters for accountable transactions and one counter for stamps and stationery. The average service time at the SB counter, accountable service counters and the stamps and stationery counter was three minutes, two and a half minutes and one minute, respectively. Swami, the postmaster, observed that the stamps and stationery line was usually the longest. However, he received the maximum complaints from customers who came for accountable transactions. He was wondering what he could do to improve customer service, especially in terms of reducing waiting times, when he received a letter from Narayanan, the Superintendent of Post Offices. The letter indicated that Malgudi had been selected as one of the post offices for computerisation. Computerisation was expected to enable the counters engaged in accountable transactions to reduce the average service time from two and a half minutes to one and a half minutes. It would also eliminate the need for customers to buy stamps for accountable transactions. The letter also indicated the possibility of introducing an improved software that would enable SB transactions to be processed as well. However, since the counter clerks would have to adapt to a wider range of activities, the average service time would now be two minutes. But the counters would now be truly multi-purpose. Swami thought that this would indeed be a boon since there was potential to improve the performance of both the SB and accountable service counters significantly. However, he soon realised that there was a catch in the proposal: the post office would have to reorganise itself to Table 1: Average Number in Waiting Line (Nq), With 95th and 99th Percentile \begin{tabular}{|c|c|c|c|c|c|c|c|c|c|c|c|c|c|} \hline Utilisation Factor & 0.10 & 0.20 & 0.30 & 0.40 & 0.50 & 0.60 & 0.70 & 0.75 & 0.80 & 0.85 & 0.90 & 0.95 & 0.98 \\ \hline \multicolumn{14}{|l|}{ Servers } \\ \hline \multirow[t]{2}{*}{15} & 0.000 & 0.000 & 0.000 & 0.001 & 0.011 & 0.072 & 0.329 & 0.654 & 1.277 & 2.533 & 5.424 & 14.952 & 44.656 \\ \hline & 00 & 00 & 00 & 00 & 00 & 03 & 27 & 510 & 815 & 1323 & 2338 & 5385 & 143223 \\ \hline \multirow[t]{2}{*}{16} & 0.000 & 0.000 & 0.000 & 0.001 & 0.009 & 0.063 & 0.303 & 0.614 & 1.220 & 2.455 & 5.322 & 14.824 & 44.510 \\ \hline & 00 & 00 & 00 & 00 & 00 & 02 & 27 & 410 & 815 & 1323 & 2338 & 5384 & 143223 \\ \hline \multirow[t]{2}{*}{17} & 0.000 & 0.000 & 0.000 & 0.000 & 0.007 & 0.055 & 0.278 & 0.577 & 1.166 & 2.381 & 5.225 & 14.700 & 44.369 \\ \hline & 00 & 00 & 00 & 00 & 00 & 02 & 26 & 410 & 715 & 1323 & 2338 & 5384 & 143223 \\ \hline \multirow[t]{2}{*}{18} & 0.000 & 0.000 & 0.000 & 0.000 & 0.006 & 0.048 & 0.256 & 0.542 & 1.116 & 2.312 & 5.132 & 14.58 & 44.232 \\ \hline & 00 & 00 & 00 & 00 & 00 & 02 & 26 & 410 & 714 & 1222 & 2338 & 5384 & 143222 \\ \hline \multirow[t]{2}{*}{19} & 0.000 & 0.000 & 0.000 & 0.000 & 0.005 & 0.041 & 0.236 & 0.511 & 1.069 & 2.245 & 5.043 & 14.465 & 44.099 \\ \hline & 00 & 00 & 00 & 00 & 00 & 01 & 16 & 49 & 714 & 1222 & 2238 & 5384 & 143222 \\ \hline \multirow[t]{2}{*}{20} & 0.000 & 0.000 & 0.000 & 0.000 & 0.004 & 0.036 & 0.218 & 0.481 & 1.024 & 2.182 & 4.957 & 14.353 & 43.970 \\ \hline & 00 & 00 & 00 & 00 & 00 & 01 & 16 & 49 & 714 & 1222 & 2238 & 5284 & 142222 \\ \hline \multirow[t]{2}{*}{25} & 0.000 & 0.000 & 0.000 & 0.000 & 0.001 & 0.019 & 0.148 & 0.362 & 0.836 & 1.905 & 4.571 & 13.839 & 43.371 \\ \hline & 00 & 00 & 00 & 00 & 00 & 00 & 05 & 38 & 613 & 1121 & 2237 & 5283 & 142221 \\ \hline \multirow[t]{2}{*}{30} & 0.000 & 0.000 & 0.000 & 0.000 & 0.000 & 0.010 & 0.102 & 0.276 & 0.691 & 1.680 & 4.243 & 13.386 & 42.834 \\ \hline & 00 & 00 & 00 & 00 & 00 & 00 & 04 & 27 & \begin{tabular}{ll} 512 \\ \end{tabular} & 1020 & 2136 & \begin{tabular}{ll} 5182 \\ \end{tabular} & 141221 \\ \hline \multirow[t]{2}{*}{35} & 0.000 & 0.000 & 0.000 & 0.000 & 0.000 & 0.005 & 0.072 & 0.213 & 0.577 & 1.491 & 3.957 & 12.979 & 42.344 \\ \hline & 00 & 00 & 00 & 00 & 00 & 00 & 03 & 16 & \begin{tabular}{ll} 411 \\ \end{tabular} & 1020 & 2035 & 5082 & 141220 \\ \hline \multirow[t]{2}{*}{40} & 0.000 & 0.000 & 0.000 & 0.000 & 0.000 & 0.003 & 0.051 & 0.166 & 0.485 & 1.331 & 3.704 & 12.609 & 41.892 \\ \hline & 00 & 00 & 00 & 00 & 00 & 00 & 02 & 05 & 311 & 919 & 2035 & \begin{tabular}{lll} 50 & 81 \\ \end{tabular} & 140220 \\ \hline \multirow[t]{2}{*}{50} & 0.000 & 0.000 & 0.000 & 0.000 & 0.000 & 0.001 & 0.026 & 0.102 & 0.348 & 1.075 & 3.275 & 11.953 & 41.075 \\ \hline & 00 & 00 & 00 & 00 & 00 & 00 & 00 & 04 & 29 & 818 & 1824 & 4980 & 139219 \\ \hline \end{tabular}Step by Step Solution
There are 3 Steps involved in it
Step: 1

Get Instant Access to Expert-Tailored Solutions
See step-by-step solutions with expert insights and AI powered tools for academic success
Step: 2

Step: 3

Ace Your Homework with AI
Get the answers you need in no time with our AI-driven, step-by-step assistance
Get Started


