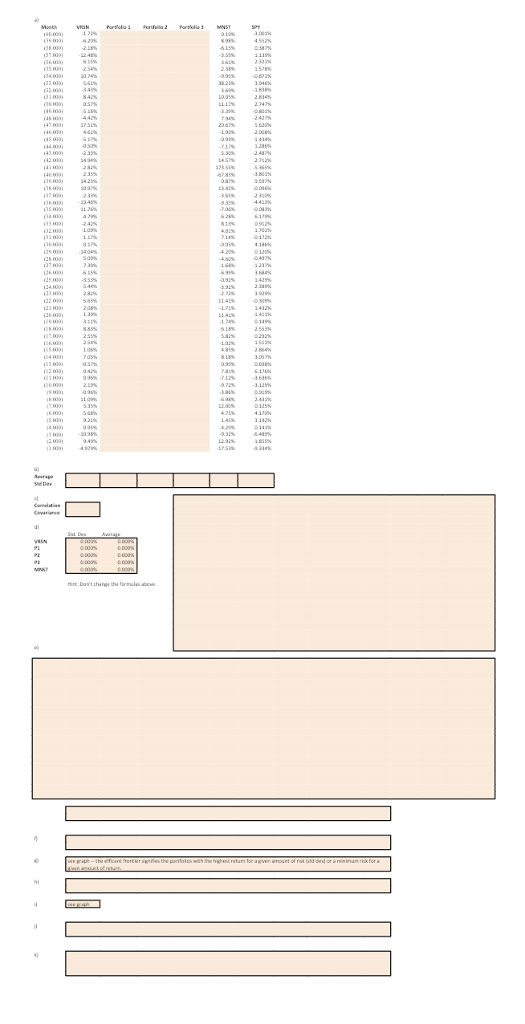
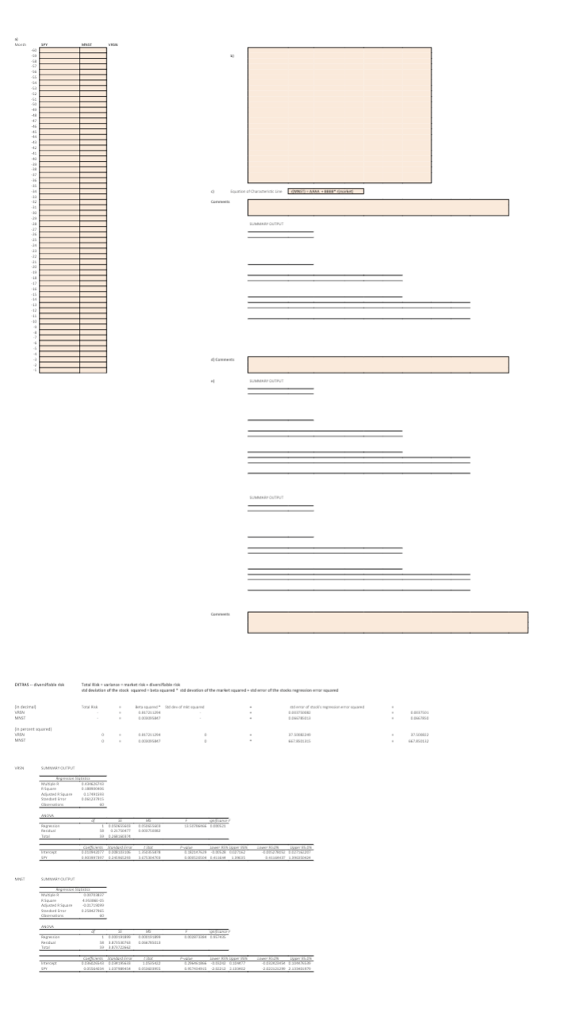
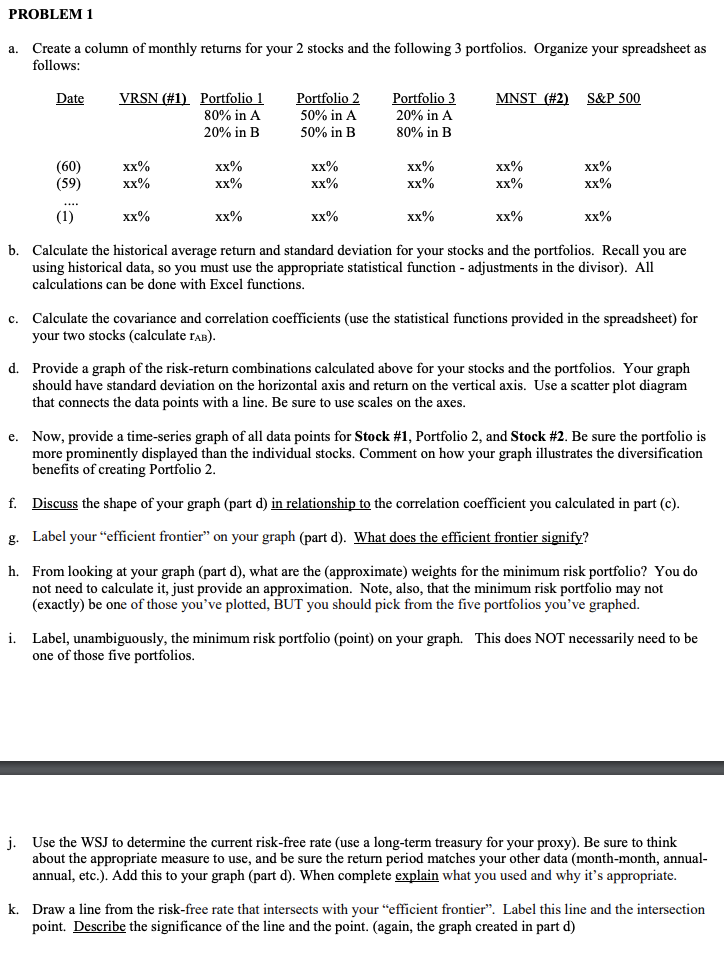
PROBLEM 1 Create a column of monthly returns for your 2 stocks and the following 3 portfolios. Organize your spreadsheet as follows a. Date VRSN(#1) Portfolio! 80% in A 20% in B Portfolio 2 50% in A 50% in B Portfolio 3 20% in A 80% in B MNST (#2) S&P500 (60) (59) xx% xx% Xx Xx Xx xx% Xx Xx Xx xx% b. Calculate the historical average return and standard deviation for your stocks and the portfolios. Recall you are using historical data, so you must use the appropriate statistical function - adjustments in the divisor). All calculations can be done with Excel functions. Calculate the covariance and correlation coefficients (use the statistical functions provided in the spreadsheet) for your two stocks (calculate rAB) c. d. Provide a graph of the risk-return combinations calculated above for your stocks and the portfolios. Your graph should have standard deviation on the horizontal axis and return on the vertical axis. Use a scatter plot diagram that connects the data points with a line. Be sure to use scales on the axes Now, provide a time-series graph of all data points for Stock #1, Portfolio 2, and Stock #2. Be sure the portfolio is more prominently displayed than the individual stocks. Comment on how your graph illustrates the diversification benefits of creating Portfolio 2. e. f. Discuss the shape of your graph (part d) in relationship to the correlation coefficient you calculated in part (c) g. Label your "efficient frontier" on your graph (part d). What does the efficient frontier signify? h. From looking at your graph (part d), what are the (approximate) weights for the minimum risk portfolio? You do not need to calculate it, just provide an approximation. Note, also, that the minimum risk portfolio may not (exactly) be one of those you've plotted, BUT you should pick from the five portfolios you've graphed. i. Label, unambiguously, the minimum risk portfolio (point) on your graph. one of those five portfolios This does NOT necessarily need to be j. Use the WSJ to determine the current risk-free rate (use a long-term treasury for your proxy). Be sure to think about the appropriate measure to use, and be sure the return period matches your other data (month-month, annual annual, etc.). Add this to your graph (part d). When complete explain what you used and why it's appropriate k. Draw a line from the risk-free rate that intersects with your "efficient frontier". Label this line and the intersection point. Describe the significance of the line and the point. (again, the graph created in part d) PROBLEM 1 Create a column of monthly returns for your 2 stocks and the following 3 portfolios. Organize your spreadsheet as follows a. Date VRSN(#1) Portfolio! 80% in A 20% in B Portfolio 2 50% in A 50% in B Portfolio 3 20% in A 80% in B MNST (#2) S&P500 (60) (59) xx% xx% Xx Xx Xx xx% Xx Xx Xx xx% b. Calculate the historical average return and standard deviation for your stocks and the portfolios. Recall you are using historical data, so you must use the appropriate statistical function - adjustments in the divisor). All calculations can be done with Excel functions. Calculate the covariance and correlation coefficients (use the statistical functions provided in the spreadsheet) for your two stocks (calculate rAB) c. d. Provide a graph of the risk-return combinations calculated above for your stocks and the portfolios. Your graph should have standard deviation on the horizontal axis and return on the vertical axis. Use a scatter plot diagram that connects the data points with a line. Be sure to use scales on the axes Now, provide a time-series graph of all data points for Stock #1, Portfolio 2, and Stock #2. Be sure the portfolio is more prominently displayed than the individual stocks. Comment on how your graph illustrates the diversification benefits of creating Portfolio 2. e. f. Discuss the shape of your graph (part d) in relationship to the correlation coefficient you calculated in part (c) g. Label your "efficient frontier" on your graph (part d). What does the efficient frontier signify? h. From looking at your graph (part d), what are the (approximate) weights for the minimum risk portfolio? You do not need to calculate it, just provide an approximation. Note, also, that the minimum risk portfolio may not (exactly) be one of those you've plotted, BUT you should pick from the five portfolios you've graphed. i. Label, unambiguously, the minimum risk portfolio (point) on your graph. one of those five portfolios This does NOT necessarily need to be j. Use the WSJ to determine the current risk-free rate (use a long-term treasury for your proxy). Be sure to think about the appropriate measure to use, and be sure the return period matches your other data (month-month, annual annual, etc.). Add this to your graph (part d). When complete explain what you used and why it's appropriate k. Draw a line from the risk-free rate that intersects with your "efficient frontier". Label this line and the intersection point. Describe the significance of the line and the point. (again, the graph created in part d)