

Answered step by step
Verified Expert Solution
Question
1 Approved Answer
Problem 1 Moving Average Models - Worksheet MA a. b. C. d. (6 Points) Under the Excel Insert Tab, choose to create an appropriate
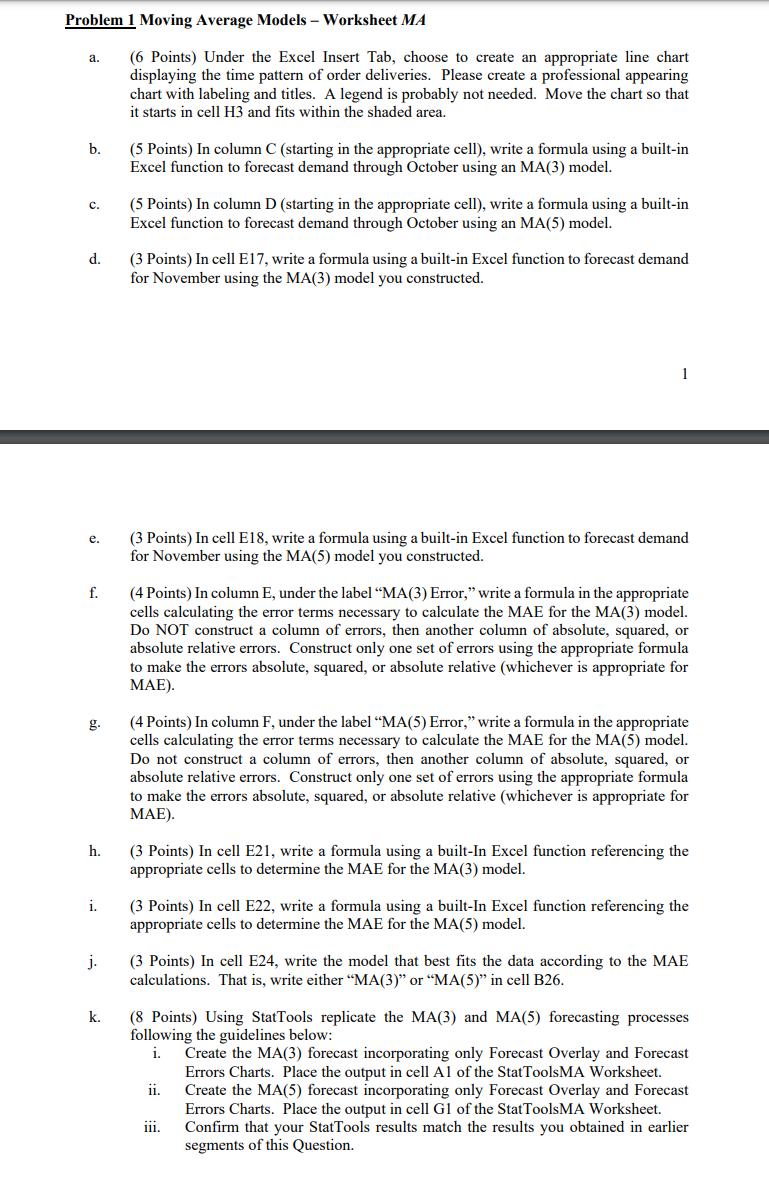
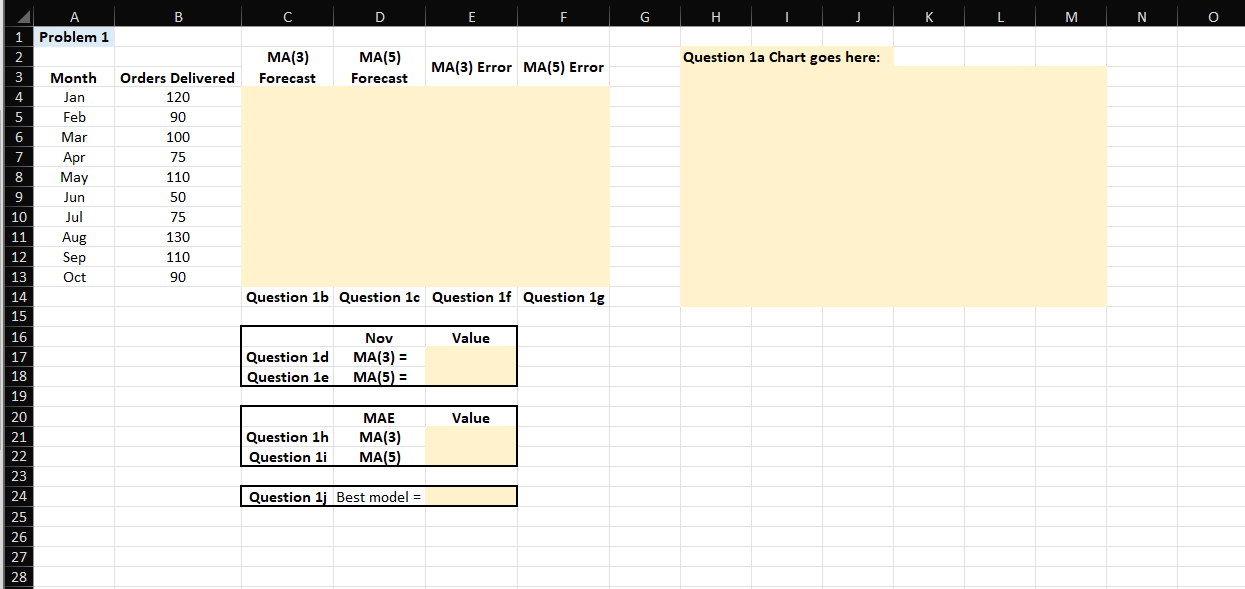
Problem 1 Moving Average Models - Worksheet MA a. b. C. d. (6 Points) Under the Excel Insert Tab, choose to create an appropriate line chart displaying the time pattern of order deliveries. Please create a professional appearing chart with labeling and titles. A legend is probably not needed. Move the chart so that it starts in cell H3 and fits within the shaded area. (5 Points) In column C (starting in the appropriate cell), write a formula using a built-in Excel function to forecast demand through October using an MA(3) model. (5 Points) In column D (starting in the appropriate cell), write a formula using a built-in Excel function to forecast demand through October using an MA(5) model. (3 Points) In cell E17, write a formula using a built-in Excel function to forecast demand for November using the MA(3) model you constructed. 1 e. f. g. h. i. j- k. (3 Points) In cell E18, write a formula using a built-in Excel function to forecast demand for November using the MA(5) model you constructed. (4 Points) In column E, under the label "MA(3) Error," write a formula in the appropriate cells calculating the error terms necessary to calculate the MAE for the MA(3) model. Do NOT construct a column of errors, then another column of absolute, squared, or absolute relative errors. Construct only one set of errors using the appropriate formula to make the errors absolute, squared, or absolute relative (whichever is appropriate for MAE). (4 Points) In column F, under the label "MA(5) Error," write a formula in the appropriate cells calculating the error terms necessary to calculate the MAE for the MA(5) model. Do not construct a column of errors, then another column of absolute, squared, or absolute relative errors. Construct only one set of errors using the appropriate formula to make the errors absolute, squared, or absolute relative (whichever is appropriate for MAE). (3 Points) In cell E21, write a formula using a built-In Excel function referencing the appropriate cells to determine the MAE for the MA(3) model. (3 Points) In cell E22, write a formula using a built-In Excel function referencing the appropriate cells to determine the MAE for the MA(5) model. (3 Points) In cell E24, write the model that best fits the data according to the MAE calculations. That is, write either "MA(3)" or "MA(5)" in cell B26. (8 Points) Using StatTools replicate the MA(3) and MA(5) forecasting processes following the guidelines below: i. Create the MA(3) forecast incorporating only Forecast Overlay and Forecast Errors Charts. Place the output in cell Al of the StatToolsMA Worksheet. ii. Create the MA(5) forecast incorporating only Forecast Overlay and Forecast Errors Charts. Place the output in cell G1 of the StatToolsMA Worksheet. Confirm that your StatTools results match the results you obtained in earlier segments of this Question. iii. Question 1a Chart goes here: A B C D E F G H 1 Problem 1 2 MA(3) MA(5) MA(3) Error MA(5) Error 3 Month Orders Delivered Forecast Forecast 4 Jan 120 5 Feb 90 6 Mar 100 7 Apr 75 8 May 110 9 Jun 50 10 Jul 75 11 Aug 130 12 Sep 110 13 Oct 90 14 Question 1b Question 1c Question 1f Question 1g 15 16 17 Question 1d Nov MA(3) = Value 18 Question 1e MA(5)= 20 25 26 2222222222 19 MAE Value 21 Question 1h MA(3) Question 1i MA(5) 23 Question 1j Best model = K M N
Step by Step Solution
There are 3 Steps involved in it
Step: 1

Get Instant Access to Expert-Tailored Solutions
See step-by-step solutions with expert insights and AI powered tools for academic success
Step: 2

Step: 3
Ace Your Homework with AI
Get the answers you need in no time with our AI-driven, step-by-step assistance
Get Started
Income Tax Fundamentals 2013
Authors: Gerald E. Whittenburg, Martha Altus Buller, Steven L Gill
31st Edition
1111972516, 978-1285586618, 1285586611, 978-1285613109, 978-1111972516