

Answered step by step
Verified Expert Solution
Question
1 Approved Answer
Problem 1) Using the Financial Statements for Joe's Gadgets, find the following ratios for 2016 and 2017. 1a. Current ratio 1b. Quick ratio (Acid Test)
Problem 1) Using the Financial Statements for Joe's Gadgets, find the following ratios for 2016 and 2017. 1a. Current ratio 1b. Quick ratio (Acid Test) 1c. Inventory Turnover Ratio 1d. Days Sales Outstanding (Average Collection Period) 1e. Fixed Assets Turnover 1f. Total Assets Turnover 1g. Total Debt to Total Assets (Debt Ratio) 1h. Total Debt to Equity 1i. Times Interest Earned 1j. Gross Profit Margin 1k. Net Profit Margin 1l. Return on Assets 1m. Return on Equity 1n. Price Earnings Ratio 1o. Market-to-Book Ratio 1p. Dividend Yield Problem 2) Using the Financial Statements for Joe's Gadgets, prepare common size income statements and balance sheets for 2016 & 2017. Problem 3) Use the following industry average ratios for 2017 and your answers to Problem 1 and Problem 2 to highlight any strengths and weaknesses for Joes Gadgets. 3a. Current ratio 1.75 3b. Quick ratio 1.00 3c. Inventory Turnover Ratio 4.75 3d. Days Sales Outstanding 50.0 3e. Fixed Assets Turnover 1.30 3f. Total Assets Turnover 0.50 3g. Total Debt to Total Assets 0.55 3h. Total Debt to Equity 1.22 3i. Times Interest Earned 3.25 3j. Gross Profit Margin 46.53% 3k. Net Profit Margin 4.88% 3l. Return on Assets 4.17% 3m. Return on Equity 12.02% 3n. Price Earnings Ratio 24.15 3o. Market-to-Book Ratio 3.98 3p. Dividend Yield 1.99% 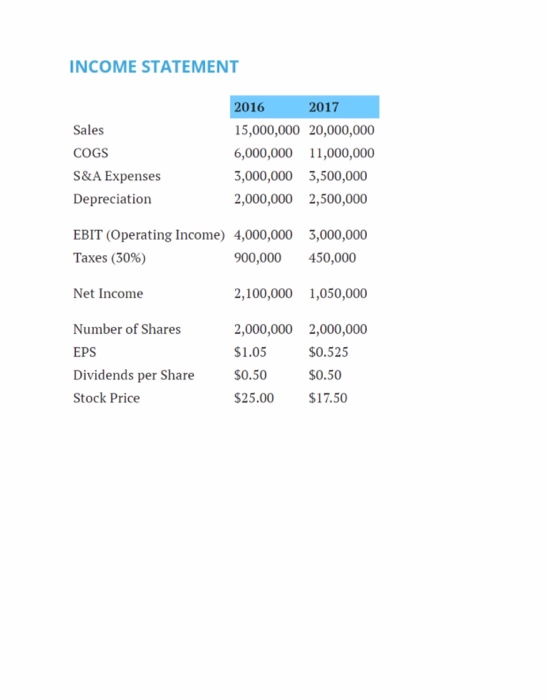
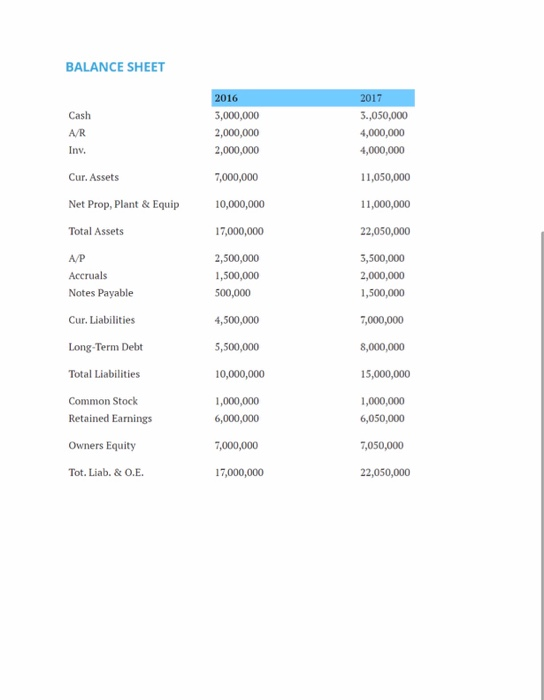 INCOME STATEMENT 2016 2017 Sales 15,000,000 20,000,000 COGS 6,000,000 11,000,000 S&A Expenses 3,000,000 3,500,000 Depreciation 2,000,000 2,500,000 EBIT (Operating Income) 4,000,000 3,000,000 Taxes (30%) 900,000 450,000 Net Income 2,100,000 1,050,000 Number of Shares EPS Dividends per Share Stock Price 2,000,000 2,000,000 $1.05 $0.525 $0.50 $0.50 $25.00 $17.50 BALANCE SHEET Cash AR Inv. 2017 3.,050,000 4,000,000 4,000,000 11,050,000 11,000,000 Cur. Assets Net Prop, Plant & Equip Total Assets A/P Accruals Notes Payable 2016 3,000,000 2,000,000 2,000,000 7,000,000 10,000,000 17,000,000 2,500,000 1,500,000 500,000 4,500,000 5,500,000 10,000,000 1,000,000 6,000,000 7,000,000 17,000,000 22,050,000 3,500,000 2,000,000 1,500,000 7,000,000 Cur. Liabilities Long-Term Debt Total Liabilities Common Stock Retained Earnings Owners Equity Tot. Liab. & C.E. 8,000,000 15,000,000 1,000,000 6,050,000 7,050,000 22,050,000
Problem 1)
Using the Financial Statements for Joe's Gadgets, find the following ratios for 2016 and 2017.
1a. Current ratio
1b. Quick ratio (Acid Test)
1c. Inventory Turnover Ratio
1d. Days Sales Outstanding (Average Collection Period)
1e. Fixed Assets Turnover
1f. Total Assets Turnover
1g. Total Debt to Total Assets (Debt Ratio)
1h. Total Debt to Equity
1i. Times Interest Earned
1j. Gross Profit Margin
1k. Net Profit Margin
1l. Return on Assets
1m. Return on Equity
1n. Price Earnings Ratio
1o. Market-to-Book Ratio
1p. Dividend Yield
Problem 2)
Using the Financial Statements for Joe's Gadgets, prepare common size income statements and balance sheets for 2016 & 2017.
Problem 3)
Use the following industry average ratios for 2017 and your answers to Problem 1 and Problem 2 to highlight any strengths and weaknesses for Joes Gadgets.
3a. Current ratio 1.75
3b. Quick ratio 1.00
3c. Inventory Turnover Ratio 4.75
3d. Days Sales Outstanding 50.0
3e. Fixed Assets Turnover 1.30
3f. Total Assets Turnover 0.50
3g. Total Debt to Total Assets 0.55
3h. Total Debt to Equity 1.22
3i. Times Interest Earned 3.25
3j. Gross Profit Margin 46.53%
3k. Net Profit Margin 4.88%
3l. Return on Assets 4.17%
3m. Return on Equity 12.02%
3n. Price Earnings Ratio 24.15
3o. Market-to-Book Ratio 3.98
3p. Dividend Yield 1.99%
Step by Step Solution
There are 3 Steps involved in it
Step: 1

Get Instant Access to Expert-Tailored Solutions
See step-by-step solutions with expert insights and AI powered tools for academic success
Step: 2

Step: 3
Ace Your Homework with AI
Get the answers you need in no time with our AI-driven, step-by-step assistance
Get Started
CISA Certified Information Systems Auditor Study Guide
Authors: David L. Cannon, Timothy S. Bergmann, Brady Pamplin
1st Edition
0782144381, 978-0782144383