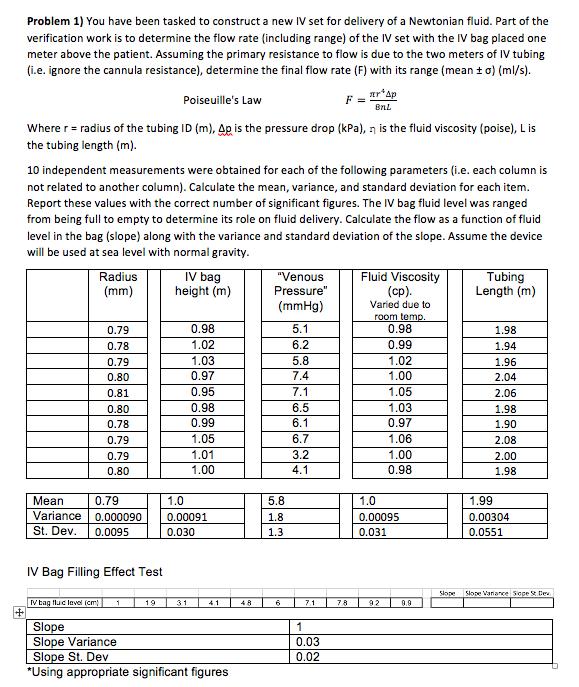
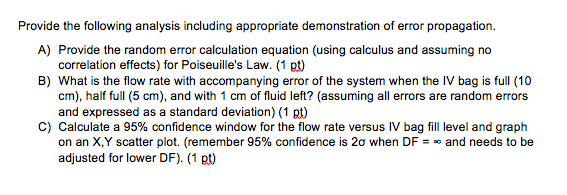
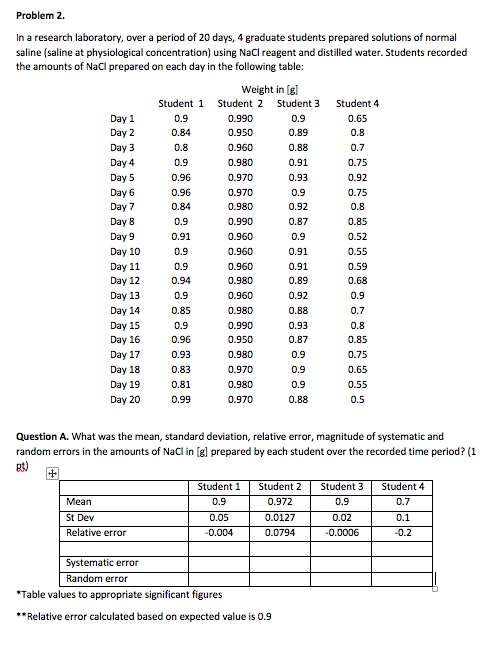
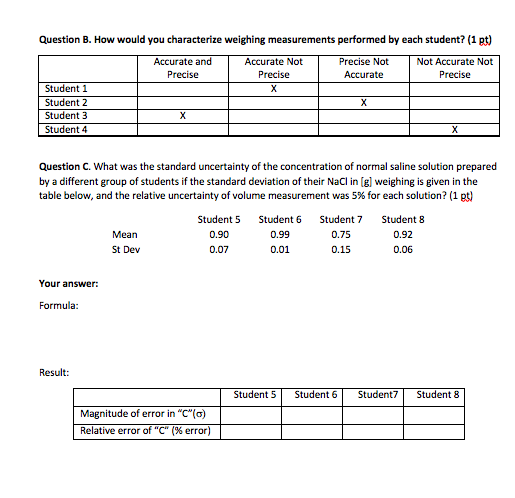
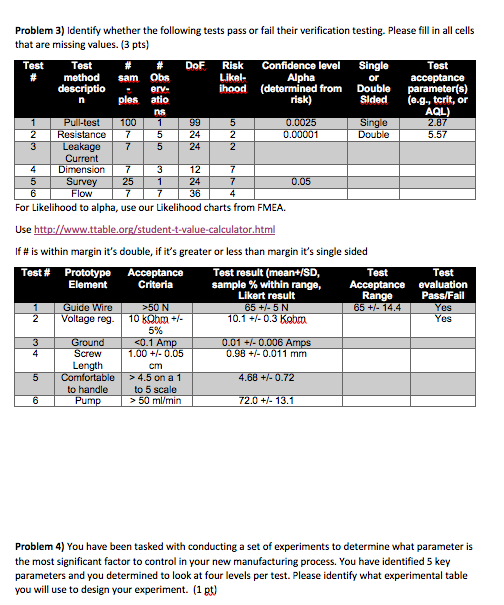
Problem 1) You have been tasked to construct a new IV set for delivery of a Newtonian fluid. Part of the verification work is to determine the flow rate (including range) of the IV set with the IV bag placed one meter above the patient. Assuming the primary resistance to flow is due to the two meters of IV tubing (i.e. ignore the cannula resistance), determine the final flow rate (F) with its range (mean to) (ml/s). Poiseuille's Law F = arap BNL Where r = radius of the tubing ID (m), Ap is the pressure drop (kPa), n is the fluid viscosity (poise), L is the tubing length (m). 10 independent measurements were obtained for each of the following parameters (i.e. each column is not related to another column). Calculate the mean, variance, and standard deviation for each item. Report these values with the correct number of significant figures. The IV bag fluid level was ranged from being full to empty to determine its role on fluid delivery. Calculate the flow as a function of fluid level in the bag (slope) along with the variance and standard deviation of the slope. Assume the device will be used at sea level with normal gravity. Radius IV bag "Venous Fluid Viscosity Tubing (mm) height (m) Pressure" (cp). Length (m) (mmHg) Varied due to room temp. 0.79 0.98 5.1 0.98 1.98 0.78 1.02 0.99 1.94 0.79 1.03 1.02 1.96 0.80 0.97 1.00 2.04 0.81 0.95 1.05 2.06 0.98 1.03 1.98 0.78 0.99 0.97 1.90 0.79 1.05 1.06 2.08 0.79 1.01 1.00 2.00 0.80 1.00 0.98 1.98 0.80 5 Mean Variance St. Dev. 0.79 0 0.000090 0.0095 1. 0.00091 0.030 Oom 0.00095 0.031 1.99 0.00304 0.0551 IV Bag Filling Effect Test TV Eag tluc lovel (cm) 1 | 19 | 31 | 41 | 48 | 6 | 71 | 78 | 92 | 98 Slope Slope Variance Slope St. Dev *Using appropriate significant figures 0.03 | 0.02 Provide the following analysis including appropriate demonstration of error propagation. A) Provide the random error calculation equation (using calculus and assuming no correlation effects) for Poiseuille's Law. (1 pt) B) What is the flow rate with accompanying error of the system when the IV bag is full (10 cm), half full (5 cm), and with 1 cm of fluid left? (assuming all errors are random errors and expressed as a standard deviation) (1 t) c) Calculate a 95% confidence window for the flow rate versus IV bag fill level and graph on an X,Y scatter plot. (remember 95% confidence is 20 when DF = - and needs to be adjusted for lower DF). (1 pt) Problem 2. In a research laboratory, over a period of 20 days, 4 graduate students prepared solutions of normal saline (saline at physiological concentration) using NaCl reagent and distilled water. Students recorded the amounts of NaCl prepared on each day in the following table: Student 1 0.9 0.84 Student 4 0.65 0.B 0.8 Weight in (el Student 2 Student 3 0.990 0.9 0.950 0.89 0.960 0.88 0.980 0.91 0.970 0.970 0.7 0.75 0.92 0.93 0.9 0.92 0.87 0.75 0.8 0.980 0.990 Day 1 Day 2 Day 3 Day 4 Day 5 Day 6 Day 7 Day 8 Day 9 Day 10 Day 11 Day 12 Day 13 Day 14 Day 15 Day 16 Day 17 Day 18 Day 19 Day 20 0.9 0.96 0.96 0.84 0.9 0.91 0.9 0.9 0.94 0.9 0.960 0.960 0.960 0.9 0.91 0.91 0.89 0.92 0.55 0.59 0.68 0.9 0.980 0.85 0.7 0.960 0.980 0.990 0.950 0.980 0.88 0.93 0.87 0.9 0.9 0.96 0.93 0.83 0.81 0.99 0.970 0.980 0.9 0.9 0.88 0.85 0.75 0.65 0.55 0.5 0.970 Question A. What was the mean, standard deviation, relative error, magnitude of systematic and random errors in the amounts of NaCl in (el prepared by each student over the recorded time period? (1 Student 1 9 Mean 0 Student 2 0.972 0.0127 0.0794 Student 3 Student 4 0. 910.7 0.02 0.1 0.0006 0.2 St Dev Relative error -0.004 Systematic error Random error *Table values to appropriate significant figures **Relative error calculated based on expected value is 0.9 Question B. How would you characterize weighing measurements performed by each student? (1 pt) Accurate and Accurate Not Precise Not Not Accurate Not Precise precise Accurate Precise Student 1 Student 2 Student 3 Student 4 X Question C. What was the standard uncertainty of the concentration of normal saline solution prepared by a different group of students if the standard deviation of their NaCl in (e) weighing is given in the table below, and the relative uncertainty of volume measurement was 5% for each solution? (1 pt) Student 5 Mean St Dev Student 6 0.99 0.01 Student 7 0.75 0.15 Student 8 0.92 0.06 0.07 Your answer: Formula: Result: Student 5 Student 6 Student Student 8 Magnitude of error in "C" (0) Relative error of "C"%error) Problem 3) Identify whether the following tests pass or fail their verification testing. Please fill in all cells that are missing values. (3 pts) Test Test DoF Risk Confidence level Single Test method sam Obs Likel- Alpha or acceptance descriptio . ery- ihood (determined from Double parameter(s) ples risk) Sided (e.g., tcrit, or AOL) Pull-test 100 1 0.0025 Single 2.87 2 Resistance7 5 24 0.00001 Double 5.57 175 242 Current 4 Dimension 7312 5 Survey 251 247 0.05 6 Flow 36 For Likelihood to alpha, use our Likelihood charts from FMEA. 5 Use http://www.ttable.org/student-t-value-calculator.html if # is within margin it's double, if it's greater or less than margin it's single sided Test # Prototype Prototype Acceptance Test result (mean+/SD, Test Element Criteria sample % within range, Acceptance Likert result Range Guide Wire >50 N 65 +/- 5 N 65 +/- 14.4 Voltage reg. 10 k m +/- 10.1 +/- 0.3 Kobim 5% 4.5 on a 1 4.68 +/- 0.72 to handle to 5 scale Pump > 50 ml/min 72.0 +/- 13.1 Test evaluation Pass/Fail Yes Yes Problem 4) You have been tasked with conducting a set of experiments to determine what parameter is the most significant factor to control in your new manufacturing process. You have identified 5 key parameters and you determined to look at four levels per test. Please identify what experimental table you will use to design your experiment. (1 pt) Problem 1) You have been tasked to construct a new IV set for delivery of a Newtonian fluid. Part of the verification work is to determine the flow rate (including range) of the IV set with the IV bag placed one meter above the patient. Assuming the primary resistance to flow is due to the two meters of IV tubing (i.e. ignore the cannula resistance), determine the final flow rate (F) with its range (mean to) (ml/s). Poiseuille's Law F = arap BNL Where r = radius of the tubing ID (m), Ap is the pressure drop (kPa), n is the fluid viscosity (poise), L is the tubing length (m). 10 independent measurements were obtained for each of the following parameters (i.e. each column is not related to another column). Calculate the mean, variance, and standard deviation for each item. Report these values with the correct number of significant figures. The IV bag fluid level was ranged from being full to empty to determine its role on fluid delivery. Calculate the flow as a function of fluid level in the bag (slope) along with the variance and standard deviation of the slope. Assume the device will be used at sea level with normal gravity. Radius IV bag "Venous Fluid Viscosity Tubing (mm) height (m) Pressure" (cp). Length (m) (mmHg) Varied due to room temp. 0.79 0.98 5.1 0.98 1.98 0.78 1.02 0.99 1.94 0.79 1.03 1.02 1.96 0.80 0.97 1.00 2.04 0.81 0.95 1.05 2.06 0.98 1.03 1.98 0.78 0.99 0.97 1.90 0.79 1.05 1.06 2.08 0.79 1.01 1.00 2.00 0.80 1.00 0.98 1.98 0.80 5 Mean Variance St. Dev. 0.79 0 0.000090 0.0095 1. 0.00091 0.030 Oom 0.00095 0.031 1.99 0.00304 0.0551 IV Bag Filling Effect Test TV Eag tluc lovel (cm) 1 | 19 | 31 | 41 | 48 | 6 | 71 | 78 | 92 | 98 Slope Slope Variance Slope St. Dev *Using appropriate significant figures 0.03 | 0.02 Provide the following analysis including appropriate demonstration of error propagation. A) Provide the random error calculation equation (using calculus and assuming no correlation effects) for Poiseuille's Law. (1 pt) B) What is the flow rate with accompanying error of the system when the IV bag is full (10 cm), half full (5 cm), and with 1 cm of fluid left? (assuming all errors are random errors and expressed as a standard deviation) (1 t) c) Calculate a 95% confidence window for the flow rate versus IV bag fill level and graph on an X,Y scatter plot. (remember 95% confidence is 20 when DF = - and needs to be adjusted for lower DF). (1 pt) Problem 2. In a research laboratory, over a period of 20 days, 4 graduate students prepared solutions of normal saline (saline at physiological concentration) using NaCl reagent and distilled water. Students recorded the amounts of NaCl prepared on each day in the following table: Student 1 0.9 0.84 Student 4 0.65 0.B 0.8 Weight in (el Student 2 Student 3 0.990 0.9 0.950 0.89 0.960 0.88 0.980 0.91 0.970 0.970 0.7 0.75 0.92 0.93 0.9 0.92 0.87 0.75 0.8 0.980 0.990 Day 1 Day 2 Day 3 Day 4 Day 5 Day 6 Day 7 Day 8 Day 9 Day 10 Day 11 Day 12 Day 13 Day 14 Day 15 Day 16 Day 17 Day 18 Day 19 Day 20 0.9 0.96 0.96 0.84 0.9 0.91 0.9 0.9 0.94 0.9 0.960 0.960 0.960 0.9 0.91 0.91 0.89 0.92 0.55 0.59 0.68 0.9 0.980 0.85 0.7 0.960 0.980 0.990 0.950 0.980 0.88 0.93 0.87 0.9 0.9 0.96 0.93 0.83 0.81 0.99 0.970 0.980 0.9 0.9 0.88 0.85 0.75 0.65 0.55 0.5 0.970 Question A. What was the mean, standard deviation, relative error, magnitude of systematic and random errors in the amounts of NaCl in (el prepared by each student over the recorded time period? (1 Student 1 9 Mean 0 Student 2 0.972 0.0127 0.0794 Student 3 Student 4 0. 910.7 0.02 0.1 0.0006 0.2 St Dev Relative error -0.004 Systematic error Random error *Table values to appropriate significant figures **Relative error calculated based on expected value is 0.9 Question B. How would you characterize weighing measurements performed by each student? (1 pt) Accurate and Accurate Not Precise Not Not Accurate Not Precise precise Accurate Precise Student 1 Student 2 Student 3 Student 4 X Question C. What was the standard uncertainty of the concentration of normal saline solution prepared by a different group of students if the standard deviation of their NaCl in (e) weighing is given in the table below, and the relative uncertainty of volume measurement was 5% for each solution? (1 pt) Student 5 Mean St Dev Student 6 0.99 0.01 Student 7 0.75 0.15 Student 8 0.92 0.06 0.07 Your answer: Formula: Result: Student 5 Student 6 Student Student 8 Magnitude of error in "C" (0) Relative error of "C"%error) Problem 3) Identify whether the following tests pass or fail their verification testing. Please fill in all cells that are missing values. (3 pts) Test Test DoF Risk Confidence level Single Test method sam Obs Likel- Alpha or acceptance descriptio . ery- ihood (determined from Double parameter(s) ples risk) Sided (e.g., tcrit, or AOL) Pull-test 100 1 0.0025 Single 2.87 2 Resistance7 5 24 0.00001 Double 5.57 175 242 Current 4 Dimension 7312 5 Survey 251 247 0.05 6 Flow 36 For Likelihood to alpha, use our Likelihood charts from FMEA. 5 Use http://www.ttable.org/student-t-value-calculator.html if # is within margin it's double, if it's greater or less than margin it's single sided Test # Prototype Prototype Acceptance Test result (mean+/SD, Test Element Criteria sample % within range, Acceptance Likert result Range Guide Wire >50 N 65 +/- 5 N 65 +/- 14.4 Voltage reg. 10 k m +/- 10.1 +/- 0.3 Kobim 5% 4.5 on a 1 4.68 +/- 0.72 to handle to 5 scale Pump > 50 ml/min 72.0 +/- 13.1 Test evaluation Pass/Fail Yes Yes Problem 4) You have been tasked with conducting a set of experiments to determine what parameter is the most significant factor to control in your new manufacturing process. You have identified 5 key parameters and you determined to look at four levels per test. Please identify what experimental table you will use to design your experiment. (1 pt)