Answered step by step
Verified Expert Solution
Link Copied!

Question

1 Approved Answer

Problem 12-6B Use ratios to analyze risk and profitability (L012-3, 12-4) (The following information applies to the questions displayed below.) Income statement and balance sheet

image text in transcribedimage text in transcribedimage text in transcribed

Problem 12-6B Use ratios to analyze risk and profitability (L012-3, 12-4) (The following information applies to the questions displayed below.) Income statement and balance sheet data for The Athletic Attic are provided below. THE ATHLETIC ATTIC Income Statements For the years ended December 31 2022 2021 Net sales $ 12,080,000 $10,600,000 Cost of goods sold 7,880,000 6,600,000 Gross profit 4,200,000 4,000,000 Expenses: Operating expenses 1,720,000 1,670,000 Depreciation expense 200,000 200,000 Interest expense 52,000 52,000 Income tax expense 544,000 470,000 Total expenses 2,516,000 2,392.000 Net income $ 1,684,000 $ 1,608,000 THE ATHLETIC ATTIC Balance Sheets December 31 2022 2021 2020 Assets Current assets: Cash Accounts receivable Inventory Supplies Long-term assets: Equipment Less: Accumulated depreciation $ 237,000 1,002,000 1,737,000 142,000 $ 167,000 752,000 1,367,000 112,000 $ 228,000 772,000 1,037,000 87,000 1,580,000 (720,000) 070 non 1,580,000 (520,000) c2 150 non 1,580,000 (320,000) c7 201 nnn THE ATHLETIC ATTIC Balance Sheets December 31 2022 2021 2020 $ 237,000 1,002,000 1,737,000 142,000 $ 167,000 752,000 1,367,000 112,000 $ 228,000 772,000 1,037,000 87,000 1,580,000 (720,000) $3,978,000 1,580,000 (520,000) $3,458,000 1,580,000 (320,000) $3,384,000 Assets Current assets: Cash Accounts receivable Inventory Supplies Long-term assets: Equipment Less: Accumulated depreciation Total assets Liabilities and Stockholders' Equity Current liabilities: Accounts payable Interest payable Income tax payable Long-term liabilities: Notes payable Stockholders' equity: Common stock Retained earnings Total liabilities and stockholders' equity $ $ $ 209,800 5,200 52,000 142,000 0 47,000 127,800 5,200 42,000 620,000 620,000 620,000 720,000 2,371,000 $3,978,000 720,000 1,929,000 $3,458,000 720,000 1,869,000 $3,384,000 Problem 12-6B Part 2 2. Calculate the following profitability ratios for 2021 and 2022: (Round your answers to 1 decimal place.) 2021 2022 % % Gross profit ratio Return on assets Profit margin Asset turnover % times times

Step by Step Solution

There are 3 Steps involved in it

Step: 1

blur-text-image

Get Instant Access to Expert-Tailored Solutions

See step-by-step solutions with expert insights and AI powered tools for academic success

Step: 2

blur-text-image

Step: 3

blur-text-image

Ace Your Homework with AI

Get the answers you need in no time with our AI-driven, step-by-step assistance

Get Started

Recommended Textbook for

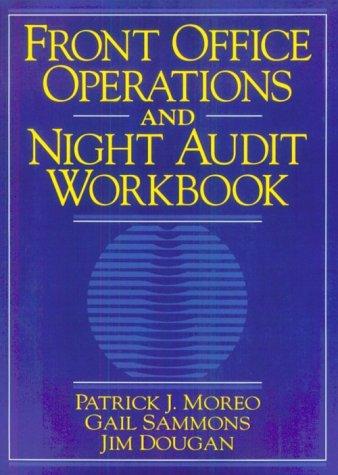
Front Office Operations And Night Audit Workbook

Authors: Patrick J. Moreo, Gail Sammons, Jim Dougan, James Dougan

1st Edition

0133987698, 978-0133987690

More Books

Students also viewed these Accounting questions