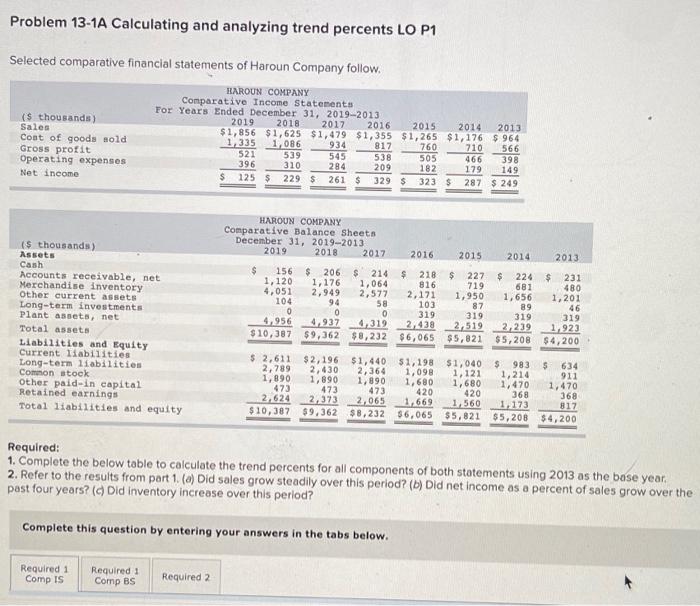
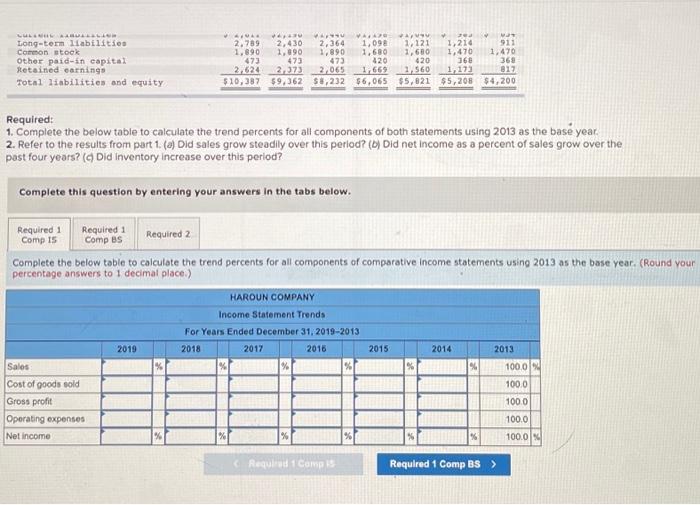
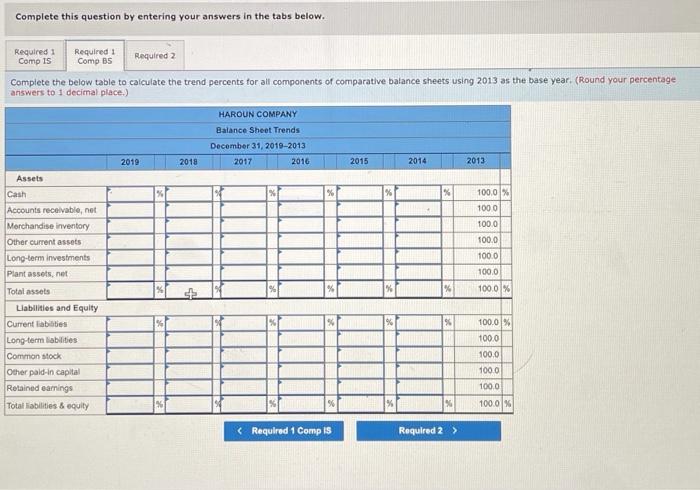
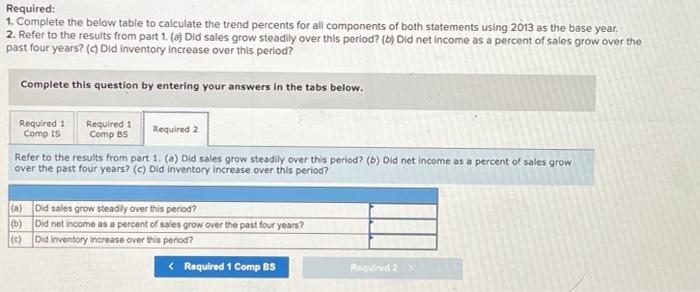
Problem 13-1A Calculating and analyzing trend percents LO P1 Selected comparative financial statements of Haroun Company follow. ($ thousands) Sales Cont of goods sold Gross profit Operating expenses Net income HAROUN COMPANY Comparative Income Statements For Years Ended December 31, 2019-2013 2019 2018 2017 2016 2015 2014 2013 $1,856 $1,625 $1,479 $1,355 $1,265 $1,176 $ 964 1,335 1,086 934 817 760 710 566 521 539 545 538 505 466 398 396 310 284 209 182 179 149 125 $ 229 $ 261 $ 329 $ 323 $ 287 $ 249 2013 $ 231 480 1,201 {$thousands) Assets Cash Accounts receivable, net Merchandise Inventory Other current assets Long-term investments Plant assets, net Total assets Liabilities and Equity Current liabilities Long-term liabilities Common stock Other paid-in capital Retained earnings Total liabilities and equity HAROUN COMPANY Comparative Balance Sheets December 31, 2019-2013 2019 2018 2017 2016 2015 2014 156 $ 206 $ 214 $ 218 $ 227 $ 224 1,120 1,176 1,064 816 719 681 4,051 2,949 2,577 2,171 1,950 104 94 1,656 58 103 87 89 0 0 0 319 319 319 4,956 4,937 4.319 2,438 2,519 2,239 $10,387 $9,362 $8,232 $6,065 $5,821 $5,208 $ 2,611 $2,196 $1,440 51,198 $1,040 $983 2,789 2, 430 2,364 1,098 1, 121 1,214 1,890 1,890 1,890 1,680 1,680 1,470 473 473 473 420 420 368 2.624 2,373 2,065 1.560 1173 $10,387 $9.362 $8,232 56,065 $5,821 $5,208 319 1.923 $4,200 $ 634 911 1,470 368 817 $4,200 Required: 1. Complete the below table to calculate the trend percents for all components of both statements using 2013 as the base year. 2. Refer to the results from part 1. (a) Did sales grow steadily over this period? (b) Did net income as a percent of sales grow over the past four years? ( Did Inventory increase over this period? Complete this question by entering your answers in the tabs below. Required 1 Comp IS Required: Comp BS Required 2 LLLLL Long-term Itabilities Common stock Other paid-in capital Retained carnings Total liabilities and equity WAVAA 2.789 2.430 2,364 1,098 1.121 1,210 911 1.890 1,090 1.890 1.680 1,600 1.470 1.470 473 473 420 36 2.624 2222 2,065 1,669 2.560 1.173 817 $10,387 59,362 $8,232 $6,065 $5,821 $5,208 $4,200 473 420 368 Required: 1. Complete the below table to calculate the trend percents for all components of both statements using 2013 as the bas year. 2. Refer to the results from part 1. (a) Did sales grow steadily over this period? (0) Did net income as a percent of sales grow over the past four years? ( Did inventory increase over this period? Complete this question by entering your answers in the tabs below. Required 1 Required 1 Comp 15 Comp BS Required 2 Complete the below table to calculate the trend percents for all components of comparative Income statements using 2013 as the base year. (Round your percentage answers to 1 decimal place) HAROUN COMPANY Income Statement Trends For Years Ended December 31, 2019-2013 2019 2018 2016 2014 2013 Sales % 100.00 Cost of goods sold 100.0 Gross profit 100.0 Operating expenses 100.0 Net Income 100.0 2017 2015 % % % % % Reque 1 Comp Required 1 Comp BS > Complete this question by entering your answers in the tabs below. Required 1 Comp Is Required 1 Comp BS Required 2 Complete the below table to calculate the trend percents for all components of comparative balance sheets using 2013 as the base year. (Round your percentage answers to 1 decimal place.) HAROUN COMPANY Balance Sheet Trends December 31, 2010-2013 2017 2016 2019 2018 2015 2014 2013 % % 100.0% 1000 Assets Cash Accounts receivable, not Merchandise inventory Other current assets Long-term investments Plant assets.net Total assets Liabilities and Equity Current liabaties Long-term abilities Common stock Other pald-in capital Retained earnings Total liabilities & equity 1000 100.0 100.0 100.0 100.0 % % % st % 100.0% 100.0 100.0 1000 100.0 100.0 % Required: 1. Complete the below table to calculate the trend percents for all components of both statements using 2013 as the base year, 2. Refer to the results from part 1. (a) Did sales grow steadily over this period? (b) Did net income as a percent of sales grow over the past four years? ( Did Inventory increase over this period? Complete this question by entering your answers in the tabs below. Required 1 Required 1 Required 2 Comp IS Comp BS Refer to the results from part 1. (a) Did sales grow steadily over this period? (b) Did net income as a percent of sales grow over the past four years? (c) Did Inventory Increase over this period? (a) Did sales grow steadily over this period? (b) Did net income as a percent of sales grow over the past four years? (c) Did Inventory increase over this period?