

Answered step by step
Verified Expert Solution
Question
1 Approved Answer
Problem 13-1A Calculation and analysis of trend percents LO A1, P1 Selected comparative financial statements of Haroun Company follow HAROUN COMPANY Comparative Income Statements For
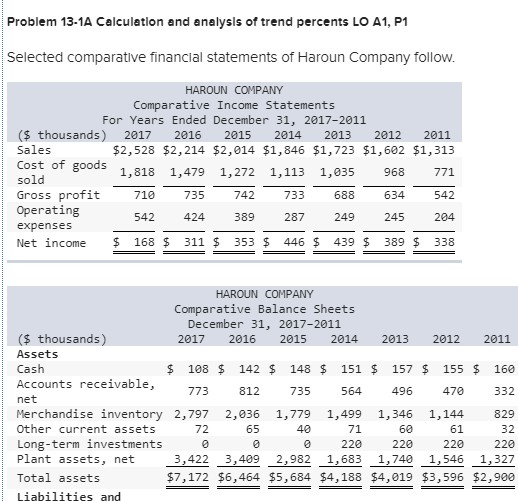
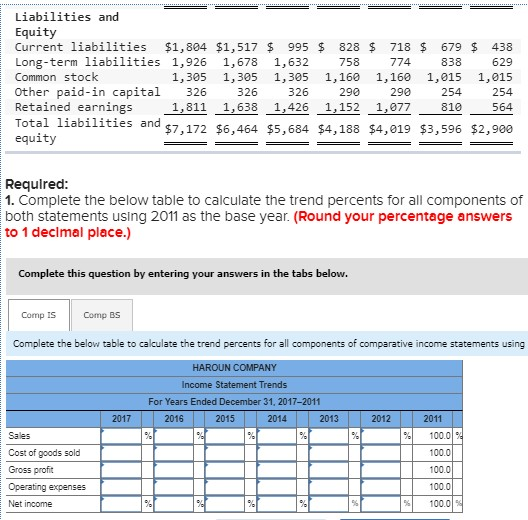
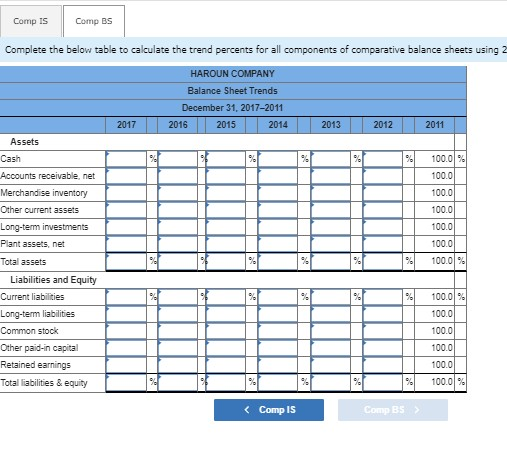
Problem 13-1A Calculation and analysis of trend percents LO A1, P1 Selected comparative financial statements of Haroun Company follow HAROUN COMPANY Comparative Income Statements For Years Ended December 31, 2017-2011 $ thousands) 2017 2016 2015 2014 2013 2012 2011 Sales Cost of goods $2,528 $2,214 $2,014 $1,846 $1,723 $1,602 $1,313 1,818 1,479 1,272 1,113 1,035 968 771 542 542 424389 287 249 245 204 446 $ 439 $ 389 $338 old arofit 542211 35 742 Gross profit Operating expenses Net income $ 168 $ 311 $353 733 688 634 HAROUN COMPANY Comparative Balance Sheets December 31, 2017-2011 (s thousands) Assets Cash Accounts receivable, ne 2017 2016 2015 2014 2013 2012 2011 $. 108$. 142$. 148 $ 151 $ 157$. 155$. 160 812 735 564 496 470 332 773 Merchandise inventory 2,797 2,036 1,779 1,499 1,346 1,144 829 Other current assets Long-term investments Plant assets, net Total assets Liabilities and 32 0 220 220 220 220 3,422 3,409 2,982 1,683 1,740 1,546 1,327 $7,172 $6,464 $5,684 $4,188 $4,019 $3,596 $2,900 72 65 40 71 60 Liabilities and Equity Current liabilities $1,804 $1,517 995 828 $ 718 $ 679 438 Long-term liabilities 1,926 1,678 1,632 758 774 838 629 Common stock Other paid-in capital 326 326 326 290 290 254 254 Retained earnings 1,811 1,638 1,426 1,152 _1,07810 Total liabilities and equity 1,305 1,305 1,305 1,160 1,160 1,015 1,015 564 $5,684 $4,188 $4,019 $3,596 $2,900 $7,172 $6,464 Required: 1. Complete the below table to calculate the trend percents for all components of both statements using 2011 as the base year. (Round your percentage answers to 1 declmal place.) Complete this question by entering your answers in the tabs below. Comp Is Comp BS Complete the below table to calculate the trend percents for all components of comparative income statements using HAROUN COMPANY Income Statement Trends For Years Ended December 31, 2017-2011 2017 2016 2015 2014 2013 2012 2011 Sales Cost of goods sold Gross profit %) 100.019 100.0 Ocerating expenses 100.0 Net income %1 100.0 Comp Is Comp BS Complete the below table to calculate the trend percents for all components of comparative balance sheets using 2 Balance Sheet Trends December 31, 2017-2011 2017 2016 2015 2014 2013 2012 2011 Assets Cash Accounts receivable, net 100.0 100.0 100.0 100.0 100.0 100.0 100.0 Other current assets Plant assets, net Total assets Liabilities and Equity Current liabilities Long-term liabilities Common stock Other paid-in capital Retained earnings Total liabilites & equity 100.0 100.0 100.0 100.0 100.0 100.0
Step by Step Solution
There are 3 Steps involved in it
Step: 1

Get Instant Access to Expert-Tailored Solutions
See step-by-step solutions with expert insights and AI powered tools for academic success
Step: 2

Step: 3
Ace Your Homework with AI
Get the answers you need in no time with our AI-driven, step-by-step assistance
Get Started
ACCA Financial Accounting Study Text 2020 21
Authors: Emile Woolf International
1st Edition
1848439210, 978-1848439214