

Answered step by step
Verified Expert Solution
Question
1 Approved Answer
Problem 13-2A (Static) Ratios, common-size statements, and trend percents LO P1, P2, P3 [The following information applies to the questions displayed below.] Selected comparative
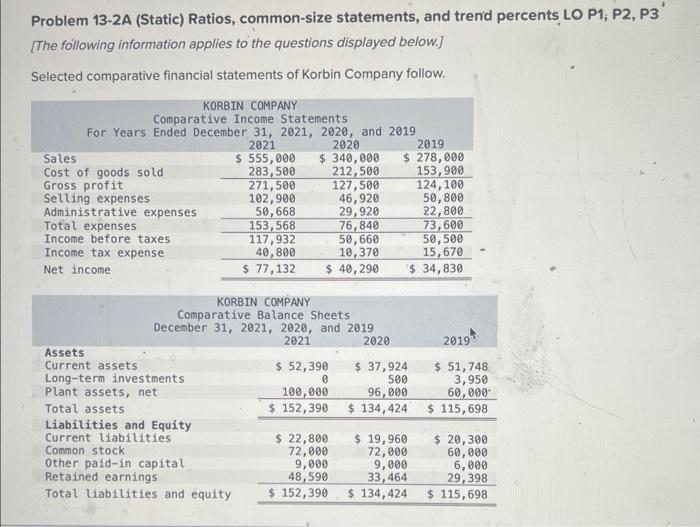
Problem 13-2A (Static) Ratios, common-size statements, and trend percents LO P1, P2, P3 [The following information applies to the questions displayed below.] Selected comparative financial statements of Korbin Company follow. KORBIN COMPANY Comparative Income Statements For Years Ended December 31, 2021, 2020, and 2019 2020 2019 $ 340,000 $ 278,000 Sales Cost of goods sold Gross profit Selling expenses Total expenses Administrative expenses Income before taxes Income tax expense Net income 2021 $ 555,000 283,500 212,500 153,900 271,500 127,500 124,100 102,900 46,920 50,800 50,668 29,920 22,800 153,568 76,840 73,600 117,932 50,660 50,500 40,800 10,370 15,670 $ 77,132 $ 40,290 $ 34,830 KORBIN COMPANY Comparative Balance Sheets December 31, 2021, 2020, and 2019 Assets Current assets Long-term investments Plant assets, net Liabilities and Equity Common stock 2021 $ 52,390 0 100,000 2020 $ 37,924 500 96,000 $ 152,390 $ 134,424 $ 19,960 Total assets Current liabilities Other paid-in capital Retained earnings Total liabilities and equity $ 152,390 $ 134,424 $ 22,800 72,000 9,000 48,590 72,000 9,000 33,464 2019 $ 51,748 3,950 60,000 $ 115,698 $ 20,300 60,000 6,000 29,398 $ 115,698
Step by Step Solution
There are 3 Steps involved in it
Step: 1

Get Instant Access to Expert-Tailored Solutions
See step-by-step solutions with expert insights and AI powered tools for academic success
Step: 2

Step: 3
Ace Your Homework with AI
Get the answers you need in no time with our AI-driven, step-by-step assistance
Get Started
Interpreting and Analyzing Financial Statements
Authors: Karen P. Schoenebeck, Mark P. Holtzman
6th edition
132746247, 978-0132746243