Question
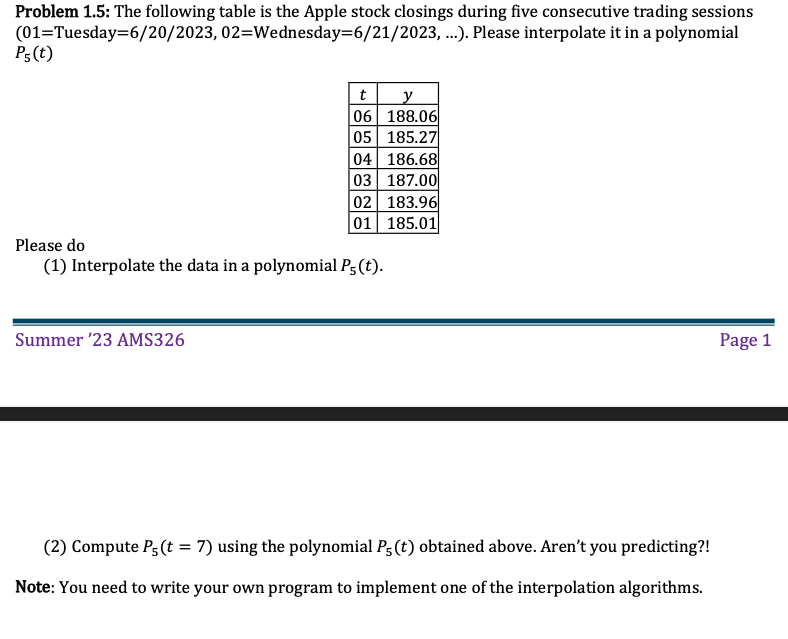
Problem 1.5: The following table is the Apple stock closings during five consecutive trading sessions (01=Tuesday=6/20/2023, 02=Wednesday=6/21/2023, ...). Please interpolate it in a polynomial

Problem 1.5: The following table is the Apple stock closings during five consecutive trading sessions (01=Tuesday=6/20/2023, 02=Wednesday=6/21/2023, ...). Please interpolate it in a polynomial P5 (t) t y 06 188.06 05 185.27 04 186.68 03 187.00 02 183.96 01 185.01 Please do (1) Interpolate the data in a polynomial P5 (t). Summer '23 AMS326 (2) Compute P5 (t = 7) using the polynomial P5 (t) obtained above. Aren't you predicting?! Note: You need to write your own program to implement one of the interpolation algorithms. Page 1
Step by Step Solution
There are 3 Steps involved in it
Step: 1
To interpolate the given data using a polynomial we can use the Lagrange interpolation method This m...
Get Instant Access to Expert-Tailored Solutions
See step-by-step solutions with expert insights and AI powered tools for academic success
Step: 2

Step: 3

Ace Your Homework with AI
Get the answers you need in no time with our AI-driven, step-by-step assistance
Get StartedRecommended Textbook for
Statistics Learning From Data
Authors: Roxy Peck
1st Edition
495553263, 978-1285966083, 1285966082, 978-0495553267
Students also viewed these Mathematics questions
Question
Answered: 1 week ago
Question
Answered: 1 week ago
Question
Answered: 1 week ago
Question
Answered: 1 week ago
Question
Answered: 1 week ago
Question
Answered: 1 week ago
Question
Answered: 1 week ago
Question
Answered: 1 week ago
Question
Answered: 1 week ago
Question
Answered: 1 week ago
Question
Answered: 1 week ago
Question
Answered: 1 week ago
Question
Answered: 1 week ago
Question
Answered: 1 week ago
Question
Answered: 1 week ago
Question
Answered: 1 week ago
Question
Answered: 1 week ago
Question
Answered: 1 week ago
Question
Answered: 1 week ago
Question
Answered: 1 week ago
Question
Answered: 1 week ago
Question
Answered: 1 week ago
View Answer in SolutionInn App


