Answered step by step
Verified Expert Solution
Question
1 Approved Answer
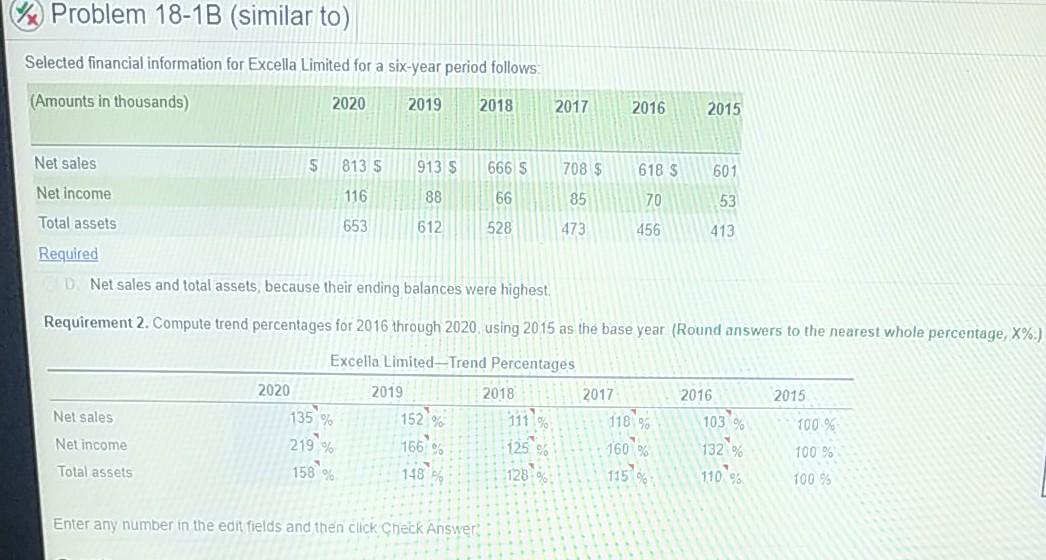
Problem 18-1B (similar to) Selected financial information for Excella Limited for a six-year period follows: (Amounts in thousands) 2020 2019 2018 2017 2016 2015 Net


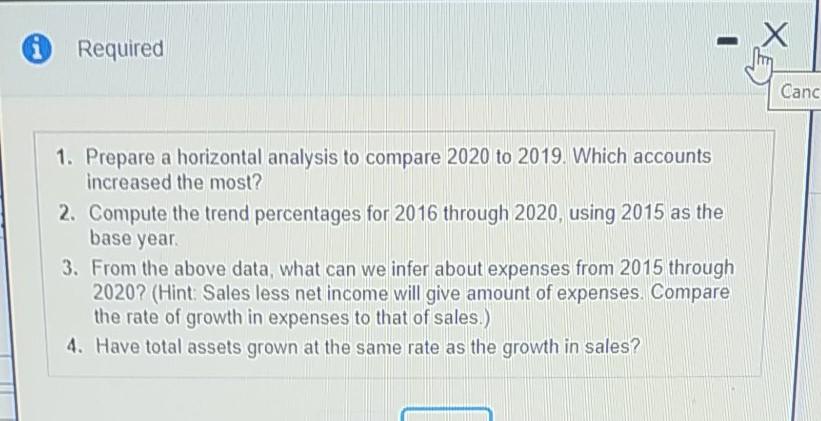
Problem 18-1B (similar to) Selected financial information for Excella Limited for a six-year period follows: (Amounts in thousands) 2020 2019 2018 2017 2016 2015 Net sales S 813 5 913 S 666 S 708 $ 618 $ 601 116 88 66 85 70 Net income Total assets 53 653 612 528 473 456 413 Required DNet sales and total assets, because their ending balances were highest Requirement 2. Compute trend percentages for 2016 through 2020 using 2015 as the base year (Round answers to the nearest whole percentage, X%.) 2016 2015 Net sales Excelia Limited --Trend Percentages 2020 2019 2018 2017 135% 152 % 111 219% 125 148 128 115% 103 % 100 % 118 % 160 % Net income 1666 132 % Total assets 158% 100 % 100 % 110% Enter any number in the edit fields and then click Check Answer Requirement 3. From the above data what can we inter about expenses from 2015 through 2020? (Hint Sales less met Income will give amount of expenses Compare the rate of growth in expanses to that of salas ) (Round percentages to the nearesi whole percentage X%. Excello Limited - Trend Percentages 2020 2019 2018 2017 2015 2015 Net sales 813 913 TOE Net Income 116 65 7 Expenses sales less niet income 2020 2019 2018 2017 2016 2015 Not solos 813 913 666 700 618 601 116 BB 66 85 70 53 Not Income Expongos (solos los not incomo) Exponse trond Not sales trond % % % % % 135 % 152 % 111% 118% 103% 100 % Enter any number in the edil fields and then click Check Answer X Required Canc 1. Prepare a horizontal analysis to compare 2020 to 2019. Which accounts increased the most? 2. Compute the trend percentages for 2016 through 2020, using 2015 as the base year 3. From the above data, what can we infer about expenses from 2015 through 2020? (Hint Sales less net income will give amount of expenses. Compare the rate of growth in expenses to that of sales.) 4. Have total assets grown at the same rate as the growth in sales? Problem 18-1B (similar to) Selected financial information for Excella Limited for a six-year period follows: (Amounts in thousands) 2020 2019 2018 2017 2016 2015 Net sales S 813 5 913 S 666 S 708 $ 618 $ 601 116 88 66 85 70 Net income Total assets 53 653 612 528 473 456 413 Required DNet sales and total assets, because their ending balances were highest Requirement 2. Compute trend percentages for 2016 through 2020 using 2015 as the base year (Round answers to the nearest whole percentage, X%.) 2016 2015 Net sales Excelia Limited --Trend Percentages 2020 2019 2018 2017 135% 152 % 111 219% 125 148 128 115% 103 % 100 % 118 % 160 % Net income 1666 132 % Total assets 158% 100 % 100 % 110% Enter any number in the edit fields and then click Check Answer Requirement 3. From the above data what can we inter about expenses from 2015 through 2020? (Hint Sales less met Income will give amount of expenses Compare the rate of growth in expanses to that of salas ) (Round percentages to the nearesi whole percentage X%. Excello Limited - Trend Percentages 2020 2019 2018 2017 2015 2015 Net sales 813 913 TOE Net Income 116 65 7 Expenses sales less niet income 2020 2019 2018 2017 2016 2015 Not solos 813 913 666 700 618 601 116 BB 66 85 70 53 Not Income Expongos (solos los not incomo) Exponse trond Not sales trond % % % % % 135 % 152 % 111% 118% 103% 100 % Enter any number in the edil fields and then click Check Answer X Required Canc 1. Prepare a horizontal analysis to compare 2020 to 2019. Which accounts increased the most? 2. Compute the trend percentages for 2016 through 2020, using 2015 as the base year 3. From the above data, what can we infer about expenses from 2015 through 2020? (Hint Sales less net income will give amount of expenses. Compare the rate of growth in expenses to that of sales.) 4. Have total assets grown at the same rate as the growth in sales
Step by Step Solution
There are 3 Steps involved in it
Step: 1

Get Instant Access to Expert-Tailored Solutions
See step-by-step solutions with expert insights and AI powered tools for academic success
Step: 2

Step: 3

Ace Your Homework with AI
Get the answers you need in no time with our AI-driven, step-by-step assistance
Get Started


