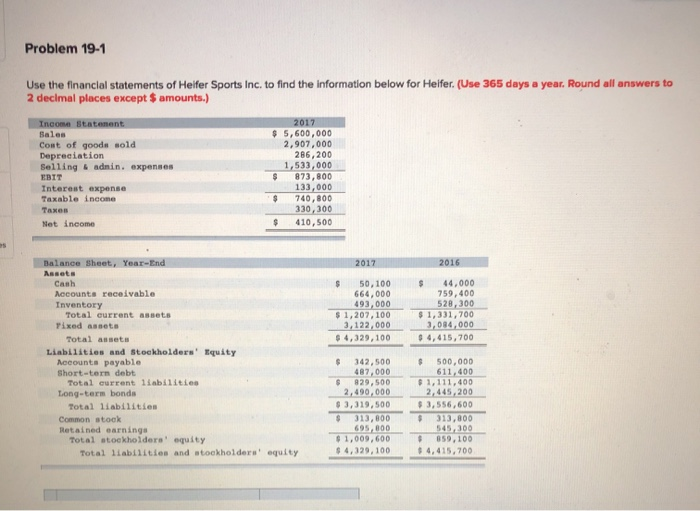
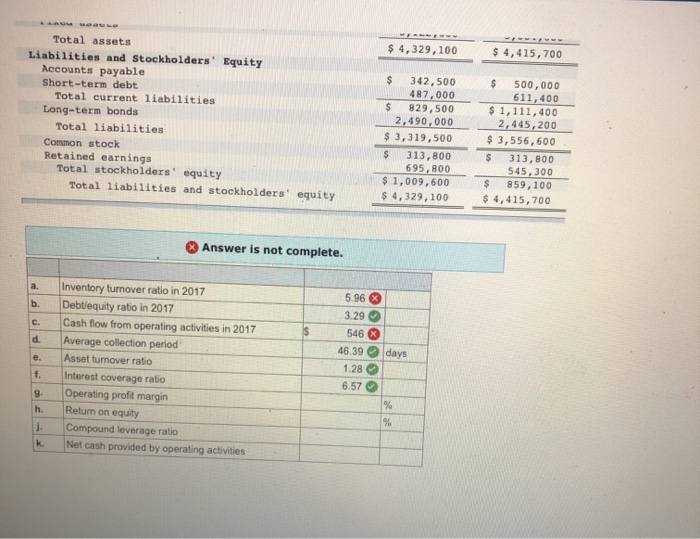
Problem 19-1 Use the financial statements of Heifer Sports Inc. to find the information below for Helfer. (Use 365 days a year. Round all answers to 2 decimal places except $ amounts.) Income Statement Coat of goods sold Depreciation Selling & admin. expenses EBIT Interest expense Taxable income Taxes Net Income 2017 $ 5,600,000 2,907,000 286,200 1,533,000 $ 873,800 133.000 740,800 330,300 410,500 2017 2016 $ 50,100 664,000 493,000 $ 1,207,100 3,122,000 9.4.329,100 $ 44.000 759,400 528,300 $1,331,700 3,084,000 94.415.700 Balance Sheet, Year-End Assets Cash Mocounts receivable Inventory Total current assets Tixed assets Total assets Liabilities and stockholders' Equity Accounts payable Short-term debt Total current liabilities Long-term bonds Total liabilities Common stock Retained earnings Total stockholders' equity Total liabilities and stockholders' equity 142,500 487.000 829,500 2,490,000 $ 3,319,500 $ 313,800 695,000 $1,009,600 $4,329, 100 $ 500,000 611,400 $1,111,400 2.445,200 $ 3,556,600 $ 313,800 545,300 $ 359,100 $4,415,700 $ 4,329,100 $ 4,415,700 Total assets Liabilities and Stockholders' Equity Accounts payable Short-term debt Total current liabilities Long-term bonds Total liabilities Common stock Retained earnings Total stockholders' equity Total liabilities and stockholders' equity $ 342,500 487,000 $ 829,500 2,490,000 $ 3,319,500 $ 313,800 695,800 $ 1,009,600 $ 4,329,100 $ 500,000 611,400 $ 1,111,400 2,445,200 $ 3,556,600 $ 313,800 545,300 $ 859,100 $ 4,415, 700 Answer is not complete. 5.96 3.29 days Inventory turnover ratio in 2017 Debuequity ratio in 2017 Cash flow from operating activities in 2017 Average collection period Asset turnover ratio Interest coverage ratio Operating profit margin Return on equity Compound leverage ratio Net cash provided by operating activities 546 46.39 1.28 6.57 e. f. g. h. 1. k